
Figure 5.
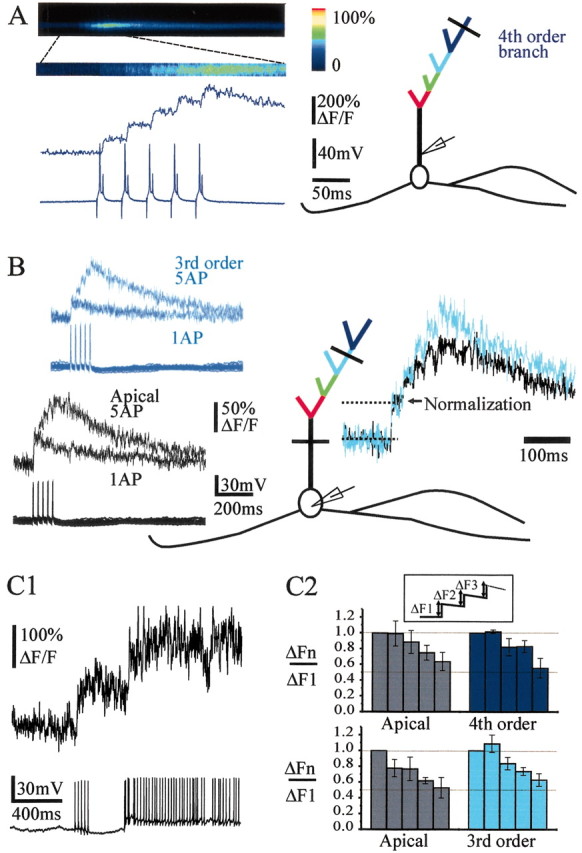
Bursts of action potentials backpropagate in the entire apical tuft. A, Left, Illustration of the protocol type used to mimic bursts of action potentials in the β-γ range, which induces a summation of Ca2+ transients (average of 18 bursts). Right, Schematic representation of the recorded mitral cell with the location of the recording pipette in the proximal part of the apical trunk and the line scan in a fourth-order branch. B, Another mitral cell recorded with an intracellular pipette placed in the soma. Left, Superpositions of Ca2+ signals evoked by one and five action potentials (interspike interval = 25 msec) in the apical trunk and in a third-order branch. Right, Superposition of the traces obtained with five action potentials at both locations and normalized to the first Ca2+ transients. Note that summation of fluorescence was sublinear in the apical trunk and in the third-order branch. C1, The sublinearity was not caused by saturation of the dye because the Ca2+ signal could still increase during higher firing frequency. C2, Histograms of ΔFn/ΔF1 (inset) in the apical trunk and branches of the third (bottom histograms) and fourth (top histograms) order. In the two series, measurements were performed at two different sites of the same cell (apical trunk vs third-order branch, n = 3, or apical trunk vs fourth-order branch, n = 3).