
Figure 6.
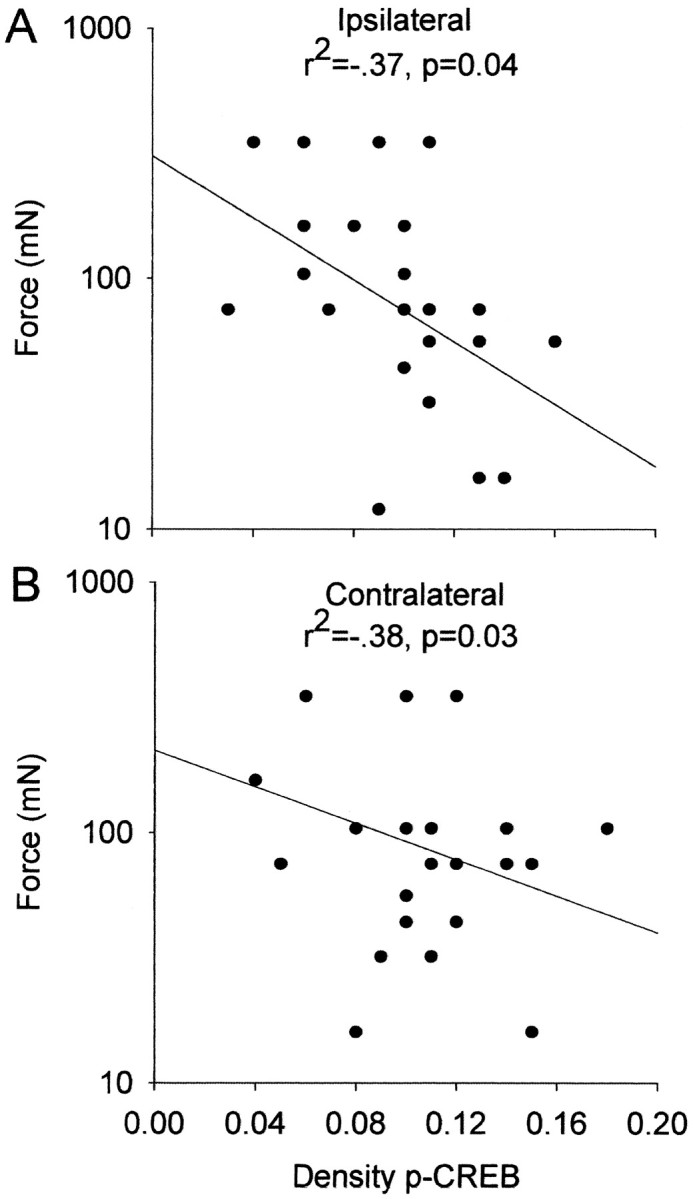
Scatter plots showing the correlation of the mechanical withdrawal threshold ipsilaterally (A) and contralaterally (B) to the density of p-CREB immunoreactivity of the superficial dorsal horn at 24 hr. All animals at 24 hr were included in the analysis, and each point represents an individual animal.