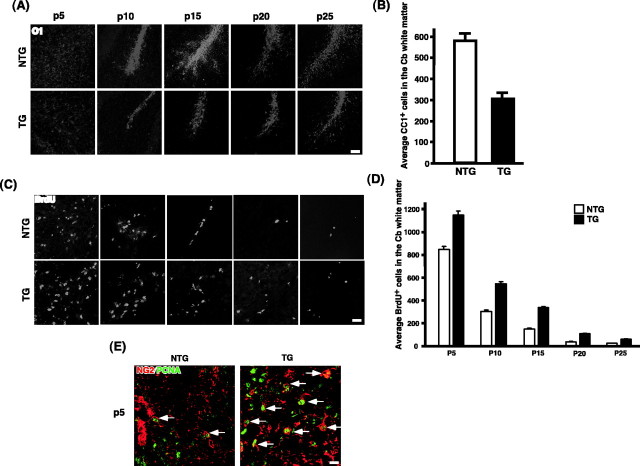
Figure 6.
A subpopulation of postmitotic oligodendrocytes undergoes apoptosis. A, Reduction in oligodendrocyte differentiation in the p75–ErbB1 KD mice. Sagittal brain sections were stained for O1 at different developmental stages. O1 staining was reduced in the white-matter tracts of the cerebellum in the transgenic mice compared with NTG at every developmental stage analyzed. A similar pattern was also observed with CNPase staining (data not shown). Scale bar, 20 μm. B, Reduction in the number of mature oligodendrocytes in the p75–ErbB1 KD mice. Quantification of CC1 + cells was done from the white-matter tract of the cerebellum using P25 mice (n = 3). Error bars indicate SEM. C, An increase in BrdU incorporation in the p75–ErbB1 KD. Sagittal brain sections were stained with anti-BrdU. BrdU staining was increased in the white-matter tracts of the cerebellum in the p75–ErbB1 KD mice compared with NTG at every developmental stage analyzed. Scale bar, 20 μm. D, Quantification of BrdU + cells in the cerebellar white-matter tract during development. Error bars indicate SEM. E, Increased proliferation of NG2 + cells in the transgenic mice. The P5 brain sections were stained for NG2 and PCNA. Note the increase in the number of NG2 +/PCNA + cells in the white-matter tracts in the cerebellum (arrows). Scale bar, 12.5 μm.

