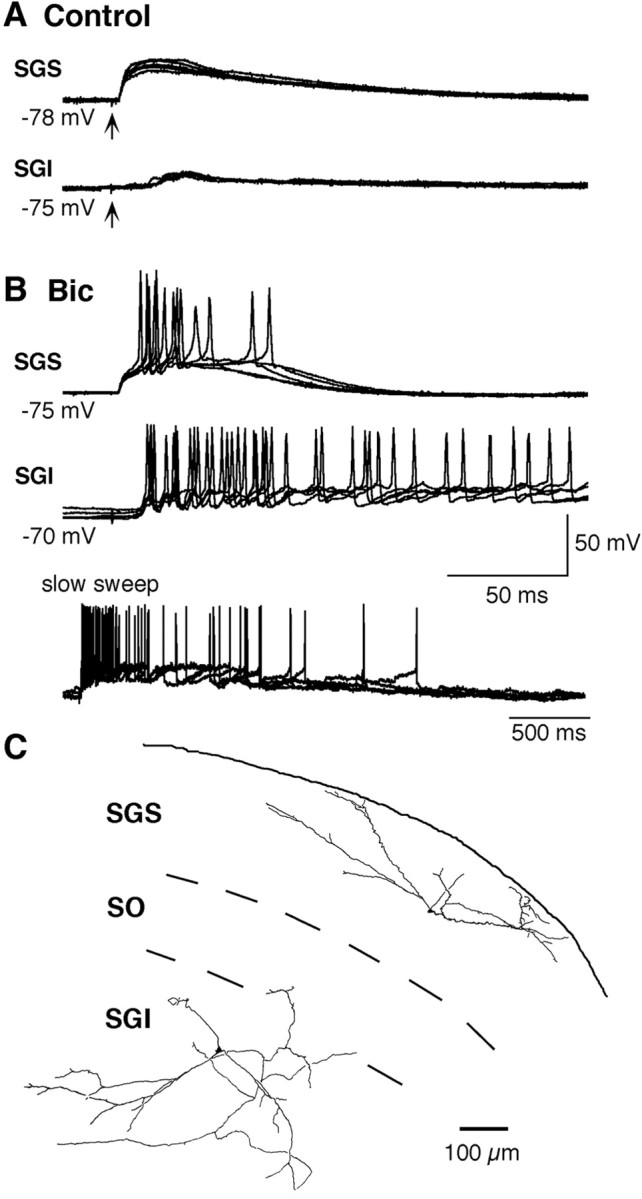
Figure 1.

Simultaneous recordings from a pair of SGS and SGI neurons. Five traces are superimposed. A, Synaptic responses in SGS (top traces) and SGI (bottom traces) neurons to stimulation of LSO (arrow, 100μA) in control solution. B, Synaptic responses in SGS (top traces) and SGI (middle and bottom traces) neurons after application of 10 μm Bic. The bottom traces are slower sweep records of the middle ones. C, Drawing of biocytin-filled SGS and SGI neurons visualized after the recordings.
