
Figure 6.
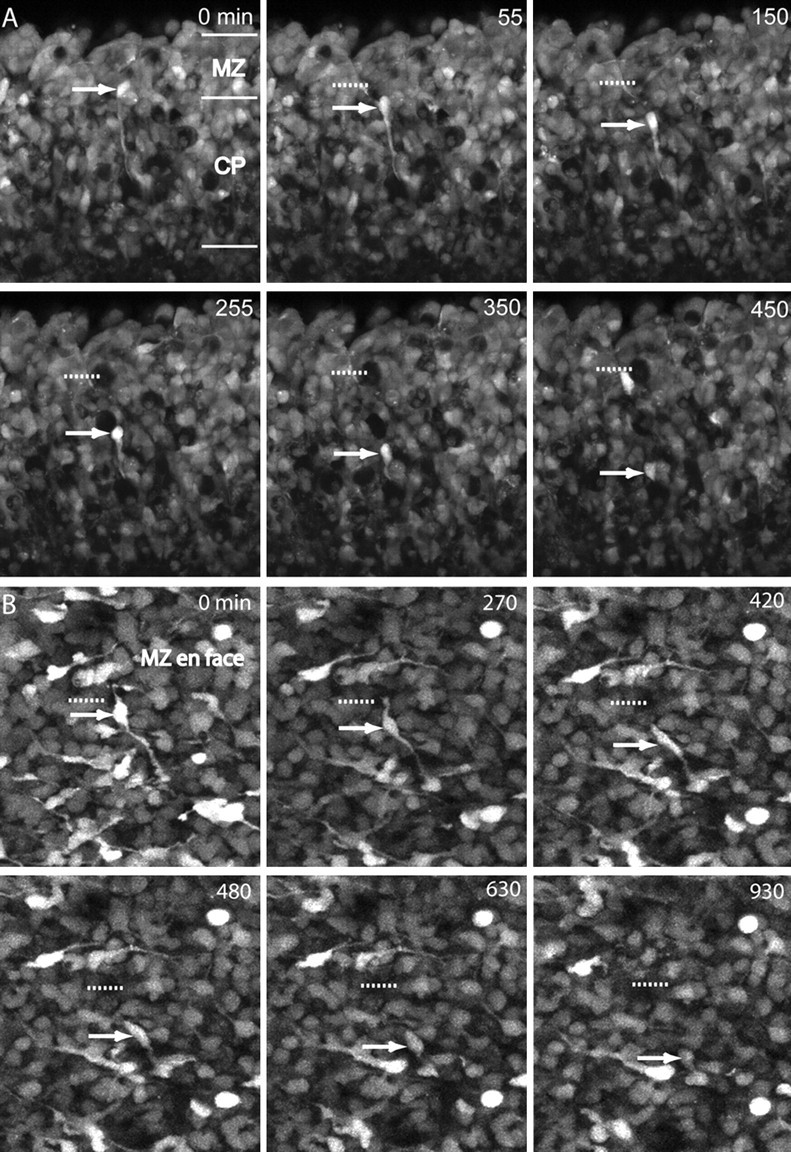
A, Time-lapse imaging of an E14 coronal slice in the MZ and CP stained with CellTracker Green. A downwardly migrating cell originating in the MZ (red arrow) moves toward its eventual position in the CP. The cell translocates its cell body toward the end of its leading process. The red dashed line shows the starting position of the cell body. The number in the top right corner is the time in minutes. B, Time lapse imaging of an E15 cortical flap stained with CellTracker Green. This series of images depicts another cell descending into the CP from the MZ from an en face view. The cell body (red arrow) follows its leading process into the depth of the explant flap, where it disappears from the field of view. The red dashed line shows the starting point of the cell body. Scale bars (A, B), 50 μm.