
Figure 8.
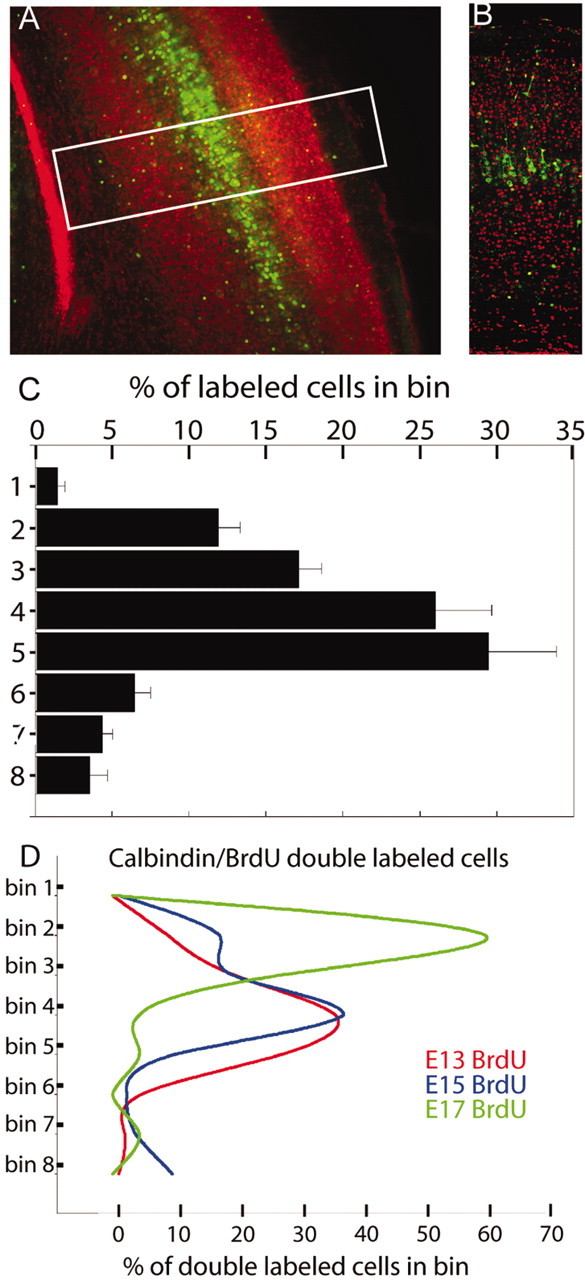
Calbindin-positive cell distribution in mouse P7 cortex. Calbindin is labeled in green, and propidium iodide labels cell nuclei in red. A, Low-power views (10×) of the cortex. A prominent band of calbindin-positive cells occurs in middle layers of the cortex. B, Corresponding montage of sections taken at higher power (25×; white rectangle in A as an example). C, To quantify the distribution of calbindin-labeled cells in the cortex, a grid made up of eight equally sized bins was overlayed on top of images such as those shown in B. The percentage of labeled cells in each bin is depicted in C. Bin 1 was positioned starting at the pia, and bin 8 fell within the white matter. D, Comparison of the distribution of double-labeled calbindin and BrdU cells in the mouse P7 cortex. The y-axis represents the eight bins of a counting grid similar to that used in B and C. An inside-out settling pattern in the cortex occurs with calbindin-positive cells injected with BrdU on E13 (red), E15 (blue), and E17 (green) (n = 3 slices for each condition). Each field of view was composed of 10 optical sections imaged 1 μm apart.