
Figure 1.
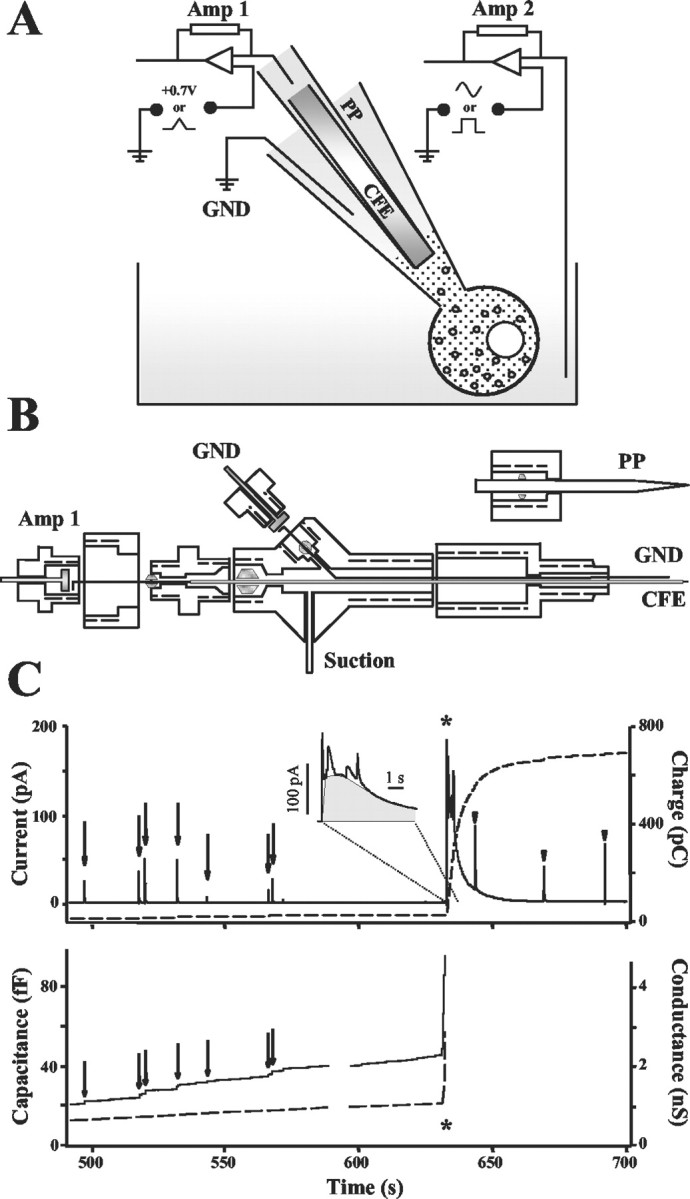
A, Schematic diagram of the IPE setup. Amp 1, Amp 2, Amplifiers; GND, electric ground; CFE, carbon fiber electrode; PP, patch pipette. B, Design of the IPE electrode holder. Two Ag|AgCl wires are connected to the GND and Amp 1 via golden-plated pins. The ground wire is in contact with the PP saline; an electrode wire supplies electric current to the CFE via polyethylene tubing filled with 3 m KCl. Air tightness between different compartments inside the holder is achieved by four rubber O-rings. C, An amperometric recording from a bovine chromaffin cell in which measurement of quantal release of catecholamines by patch amperometry is followed by IPE in amperometric mode. Asterisks indicate the time when the patch was disrupted by suction and a whole-cell configuration was attained. Amperometric current from the CFE (top, solid line), its running integral (top, dashed line), membrane capacitance (bottom, solid line), and conductance (bottom, dashed line) were monitored simultaneously during the same recording. Quantal events in the patch are indicated by amperometric spikes and capacitance steps (arrows). In ∼50% of the recordings, the slow amperometric current wave had superimposed quantal spikes, indicating vesicles diffusing out of the cell and bursting on contact with the CFE (arrowheads). The inset displays a magnification of the initial phase of the slow oxidation wave. The first sharp peak from the left is an artifact resulting from suction. The gray area shows the portion of the peak considered to represent the cytosolic molecules.