
Figure 6.
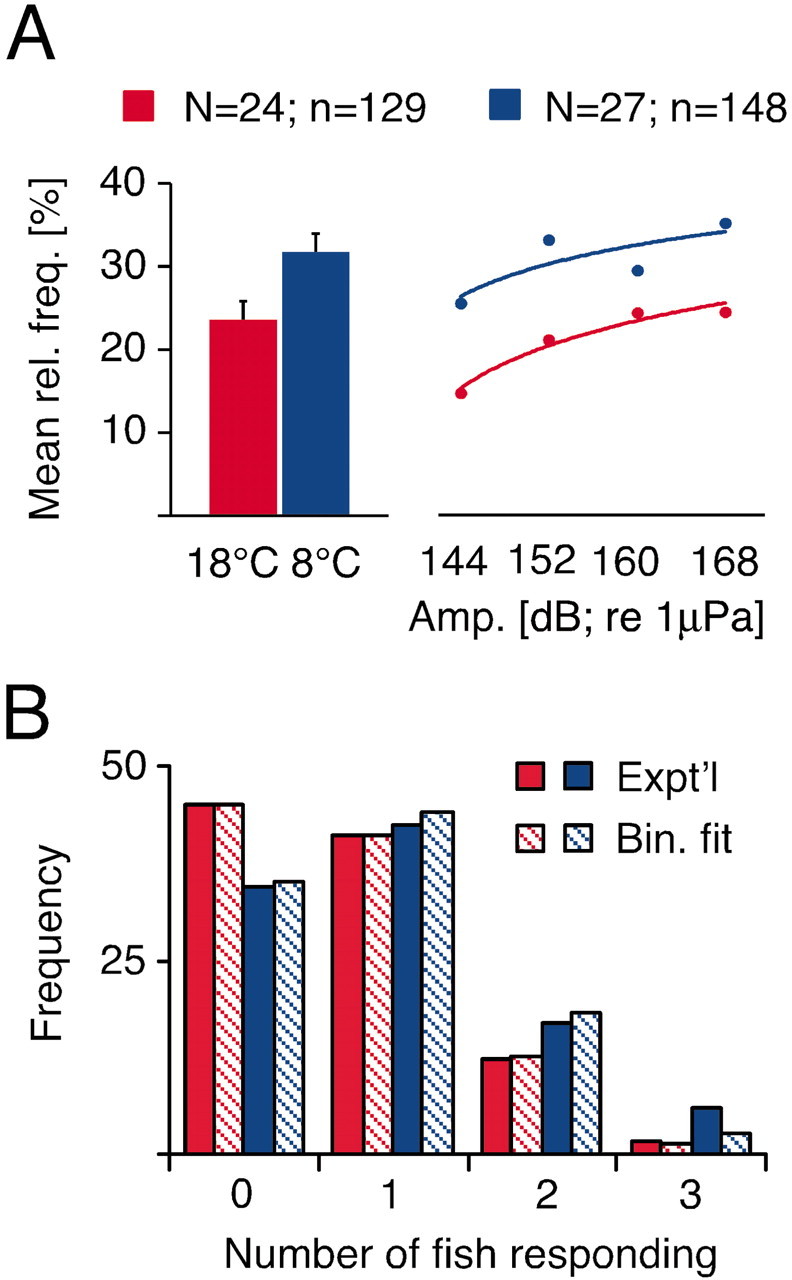
A, Relationship between escape responsiveness and acute temperature exposure. Left, Bar plots of mean relative frequencies of sound-evoked C-starts calculated from individual experimental trials with three animals each at 18 (red) and 8°C (blue). For the right part of the graph the same data were separated into four distinct intensity bins ranging from 140 to 148, 149 to 156, 157 to 164, 165 to 170 dB, respectively. B, Bar plots of the frequencies (%) with which 0, 1, 2, or 3 fish responded per trial (solid) at the two experimental temperatures, compared with the predicted distributions (hatched), assuming a simple binomial model (see Results for details and statistics).