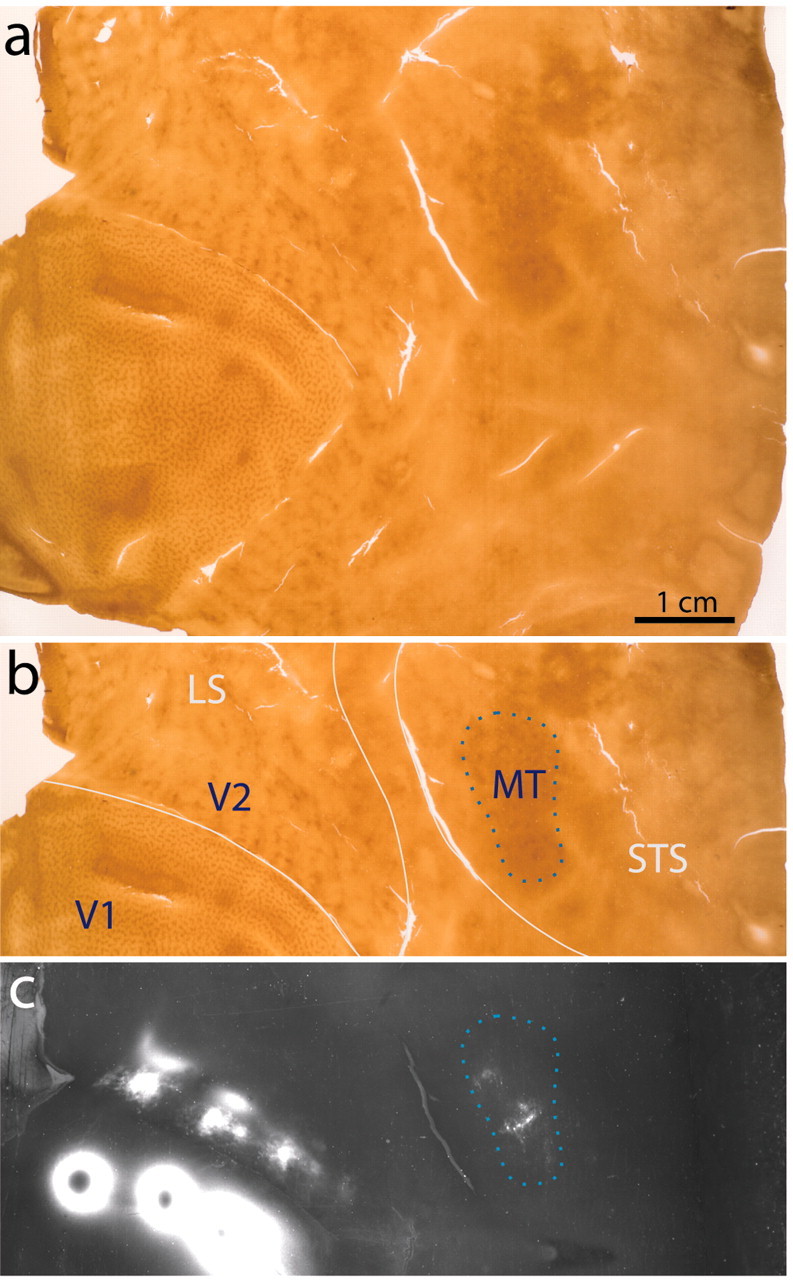
Figure 1.

Location of V1 projection zones in V2 and MT. a, Single flatmount section cut through the superficial layers of the right occipital cortex of a macaque, showing the CO pattern in V1, V2, and MT. b, Same section as in a with areas identified and sulci outlined in white. Sulcal boundaries are tracked during the unfolding process. The blue dotted line indicates area MT as judged by the CO pattern. c, Adjacent section to a, processed for autoradiography and photographed in dark-field. The large [3H]proline injections in V1 lead to anterogradely labeled fields of axon terminals centered in V2 and MT. Scale bar, 1 cm.
