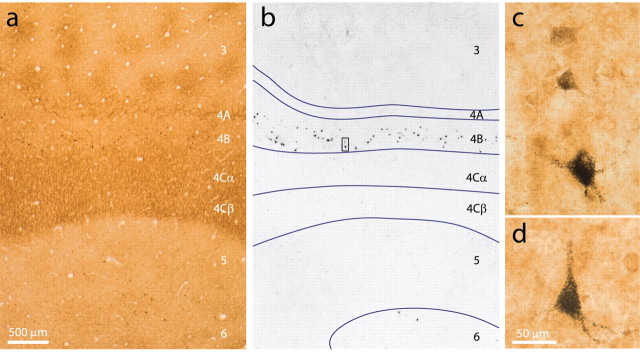
Figure 3.
MT-projecting cells in V1. a, Brightfield image of a CO-stained section containing CTB-labeled cells. Many layers are visible in this area because the plane of section was oblique to the cortical surface. b, Inverted dark-field image of the same section in a, showing that CTB labeling was found only in layers 4B and 6. Laminar boundaries (blue) are taken from the CO pattern. c, High magnification view of the boxed field in b, showing light, medium, and heavily labeled neurons. The two top labeled cells were also CO-rich, as evident in the proximal dendrite staining. d, Pyramidal cell from the next section. Its apical dendrite was cut off where it left the section. Stellate cells (c, top) had no apical process. Scale bars: a, b, 500 μm; c, d, 50 μm.

