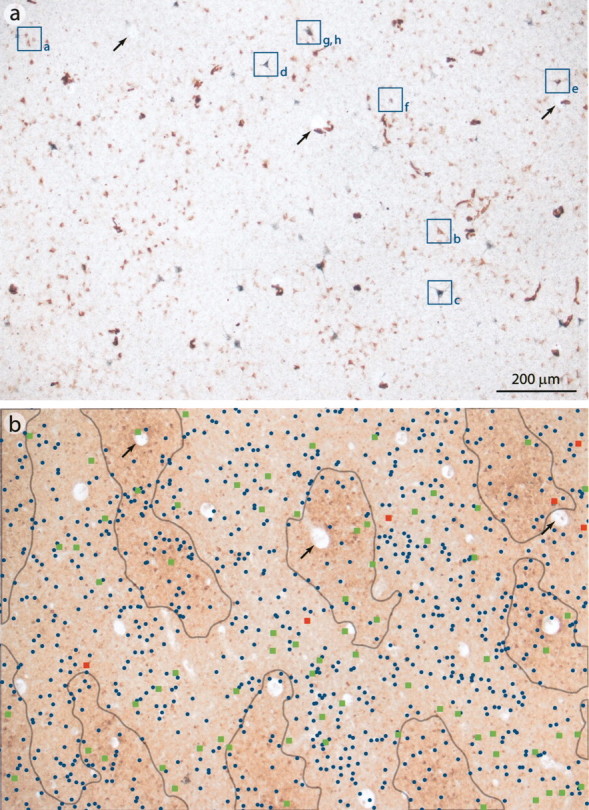
Figure 4.

Three different output populations in layer 4B. a, A single section cut tangentially through layer 4B of Monkey 1, processed for WGA–HRP and CTB. Individually lettered neurons are shown at higher magnification in Figure 5. b, Desaturated image of the CO pattern in layer 3, showing the distribution of labeled cells in a in patch (gray outline) and interpatch compartments. Blue dots indicate WGA–HRP-labeled cells projecting to V2, green squares indicate CTB cells projecting to MT, and red squares indicate double-labeled cells. Black arrows point to blood vessels used for alignment. Scale bar, 200 μm.
