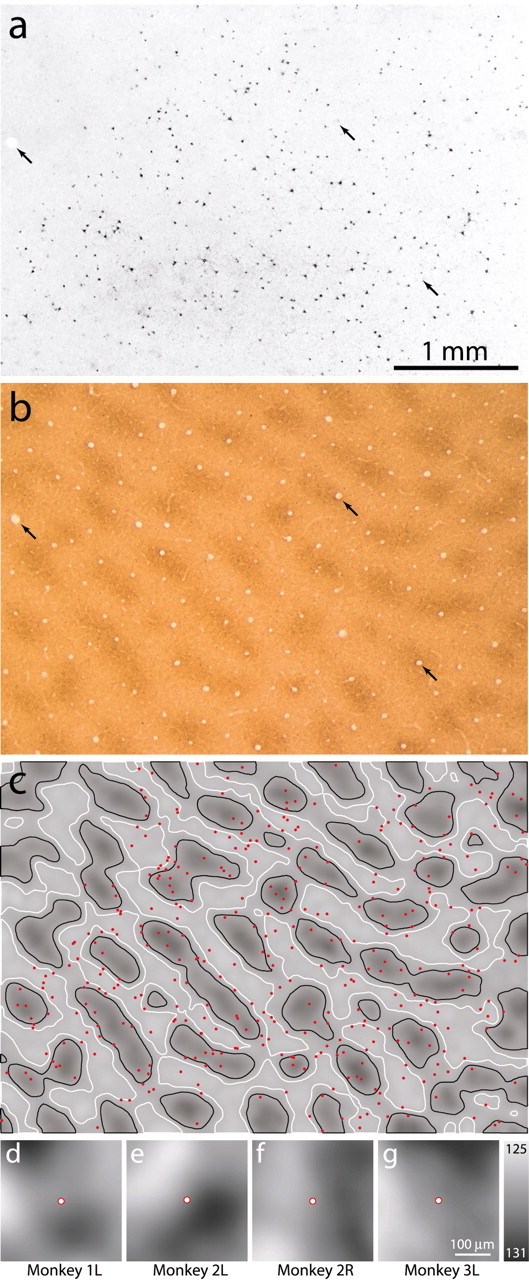
Figure 6.

MT-projecting cells are independent of the CO patch system. a, Inverted dark-field image of CTB-labeled cells in layer 4B. The top left corner of the section passed out of layer 4B. Black arrows point to blood vessels used for alignment. b, CO section from layer 3 aligned with the section in a. c, Gray-level rendered image of CO density, divided into three zones of equal area forχ2 analysis: patch (inside black contours), border (between black and white contours), and interpatch. Cells (red) plotted over the density image from a, showing no tendency to cluster in any zone. Spatial correlation analysis showed that the mean CO density in the neighborhood of MT-projecting cells was not clearly related to patches in this case (d), nor in three other hemispheres (e–g) at different eccentricities (Table 2). Spatial correlation values were contrast enhanced because they were of very low amplitude, ranging within ± 3 from mean gray (128) as indicated by the gray-scale bar. Scale bars: a–c, 1 mm; d–g, 100 μm.
