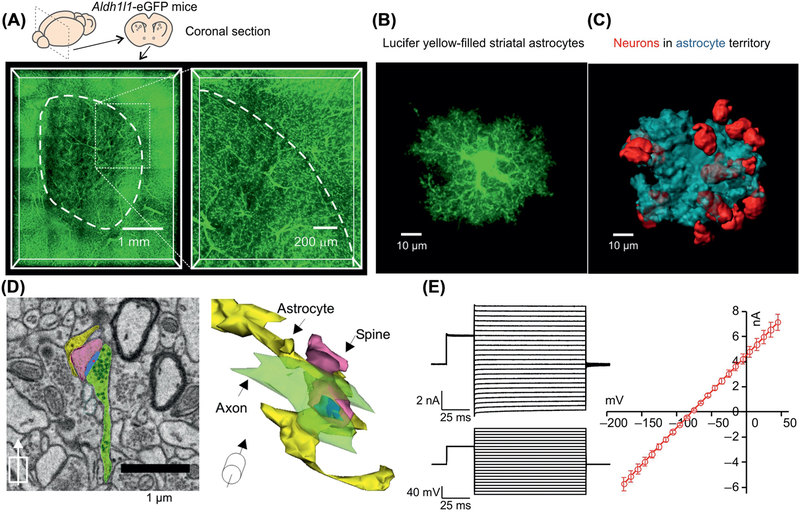
Figure 3. Properties of Striatal Astrocytes.
(A) Coronal sections of Aldh1l1-eGFP mouse brains cleared using the Sca/eS method and imaged using confocal microscopy to show abundant astrocytes within the striatum. The magnified section on the right shows the dorsolateral region of the striatum. Blood vessels are demarcated by their associations with GFP-expressing astrocyte end-feet. (B) Confocal volumes of a Lucifer yellow-filled striatal astrocyte. (C) 3D reconstructions of volumes enclosed by striatal astrocyte territories (blue) and NeuN (red). (D) Example of scanning electron microscopy (SEM) image from the striatum with corresponding 3D rendering displayed at an angle. The synaptic structures and closest astrocyte processes are colored as follows: yellow, astrocytes; blue, postsynaptic densities (PSDs); green, axons; and pink, spines. The center of the PSD is denoted by a red dot. (E) Representative current waveforms for a striatal astrocyte in response to stepwise changes membrane potential, along with an average current voltage relation from multiple cells. Reproduced from [50] (A–D); data in (E) from [51].

