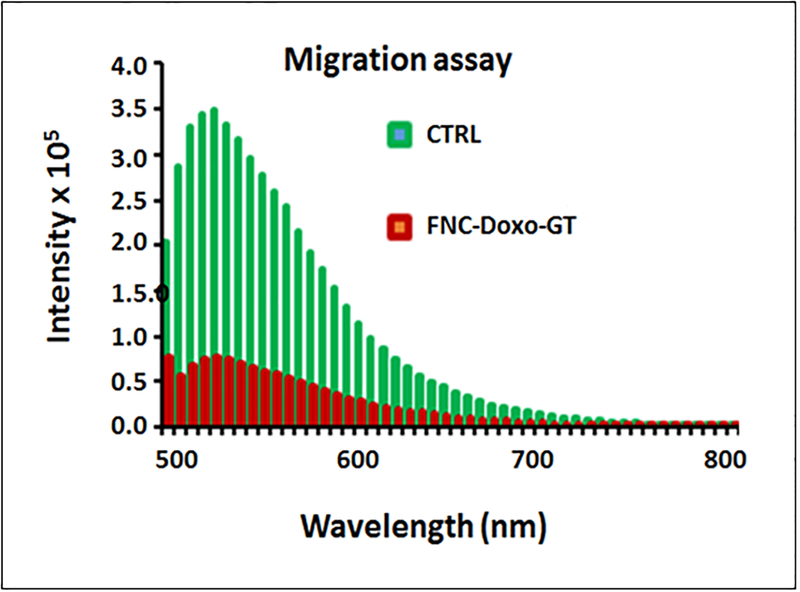
Figure 8.
Assessment for the inhibition of migration of highly metastatic A549 cells via migration assay. Control cells (green lines) incubated with FNC with no drug showed maximum invasion, whereas, combination of drugs carrying FNC (red lines) treated A549 cells showed minimal migration. The sample average value of three successive measurements is presented in both CTRL and FNC-Doxo-GT experiments.

