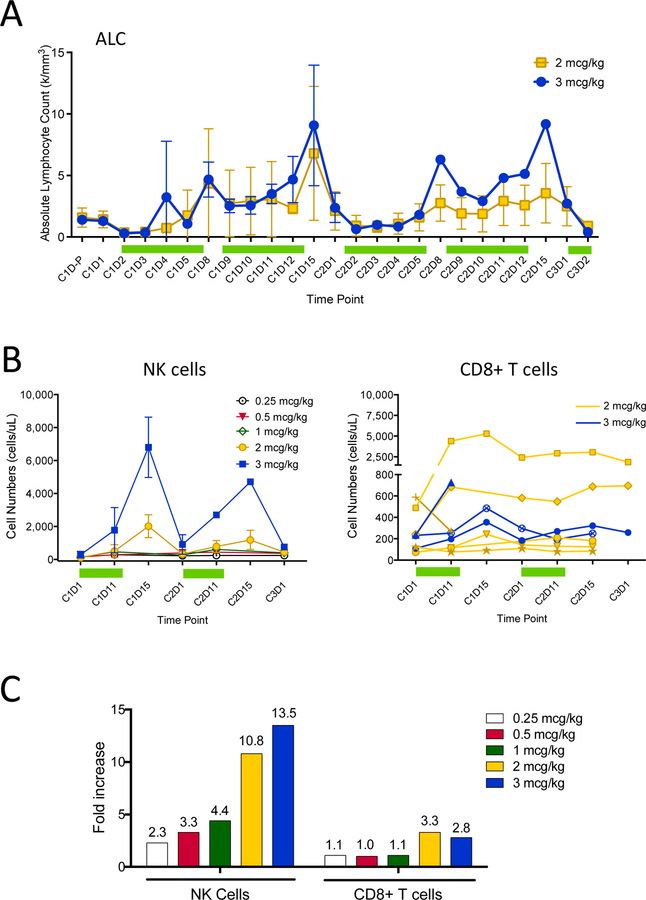
Figure 2. Circulating lymphocyte, NK and CD8+ T cell numbers before and during rhIL-15 treatment.
Absolute lymphocyte counts were calculated from CBC data obtained daily from individual subjects’ local labs for the 2 mcg/kg/day (yellow, N=6) and 3 mcg/kg/day (blue, N=3) dose cohorts, and includes a pre-cycle 1 day1 (C1D-P) time point (A). Each line/symbol represents mean results from each dose cohort with error bars (±1SD). Green bars represent periods of daily rhIL-15 treatment. Absolute cell frequencies (cells/mcL) of CD45+CD3-CD56+ NK cells in fresh whole blood were measured using Trucount tubes and are shown as means (±1SD) grouped by dose cohort (B, left). Absolute cell frequencies (cells/mcL) of CD45+CD3+CD8+ T cells among subjects treated with 2 or 3 mcg/kg/day of rhIL-15 is shown (B, right). Each line/symbol represents results from a single individual from the 2 and 3 mcg/kg/day dose cohorts as shown in (A). Mean fold-increases for whole blood NK and CD8+ T cell frequencies during cycle 1 at days 11 or 15 (whichever was available and/or maximal) compared to baseline (day 1) for all treated subjects is shown, grouped by dose cohort (C). Mean CD56+ NK cell fold increases (± 1SD) for the 0.25 (N=3), 0.5 (N=3), 1 (N=3), 2 (N=6), and 3 (N=3) mcg/kg dose cohorts were 2.3 (± 1.2), 3.3 (± 2.3), 4.4 (± 3.2), 10.8 (± 8.2), and 13.5 (± 6.6) respectively. Mean CD8+ T cell fold increases (± 1SD) for the 0.25, 0.5, 1, 2, and 3 mcg/kg dose cohorts were 1.1 (±0.2), 1.0 (±0.2), 1.1 (±0.2), 3.3 (± 3.8), and 2.8 (± 0.6) respectively.

