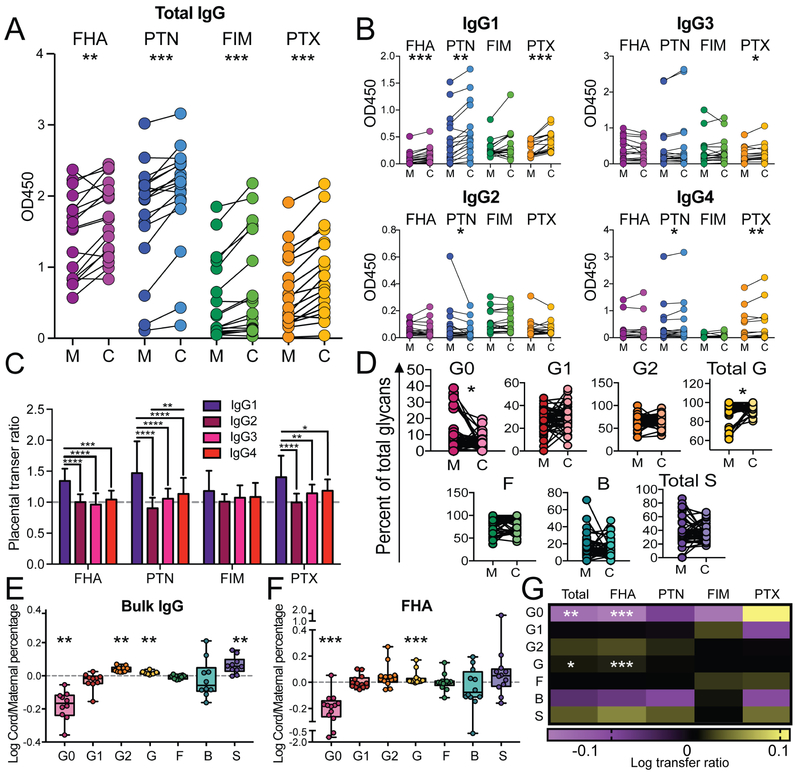
Figure 3: Subclass and glycosylation transfer profiles.
To define the biophysical signatures that drive selective placental transfer, subclass and Fc-glycosylation profiles of pertussis-specific antibodies were interrogated across the mother:cord samples. A. The dot-line plot shows the level of total IgG antibodies for each of the pertussis vaccine antigens (FHA, PTN, FIM, and PTX) across mother:cord pairs. B. The dotline plots highlight the paired IgG1, IgG2, IgG3, and IgG4 levels for each of the 4 pertussis antigens. C. The bar graph depicts the overall transfer efficiency (cord/mother) for each subclass across all 4 antigens. D. The dot-line plot shows the major Fc-glycan profile levels (G0=agalactosyalted, G1=mono galactosylated, G2=digalactosylated, Total G=both G1 and G2, F=fucosylated, B=bisecting GLcNAc, Total S=total sialylated including both S1 and S2) for all antigen specificities across mother:cord pairs. E. The whisker box plots show the transfer efficiency (cord/mother) for each of the major Fc-glycan profiles for total circulating antibodies (bulk IgG) and FHA (right). G. The heat map shows the transfer ratios for antigen-specific glycosylation, across all specificities combined (total) or for individual antigen-specific antibody populations, where positive correlations are depicted in yellow, and inverse correlations are plotted in purple. Significance for dot/line analysis included a Wilcoxon test with a Bonferroni correction, where p<0.0125 was considered significant, *p<0.0125, **p<0.0025, ***p<0.00025. For the bar graph, significance was evaluated using a two-way ANOVA with a Tukey’s post-test correction. For transfer ratios, significance was evaluated using a Wilcoxon signed rank test, after variation of median was assessed from zero, and was corrected with a Hochberg’s step-up procedure, with **p<0.01, ***p<0.001. See also Figure S4

