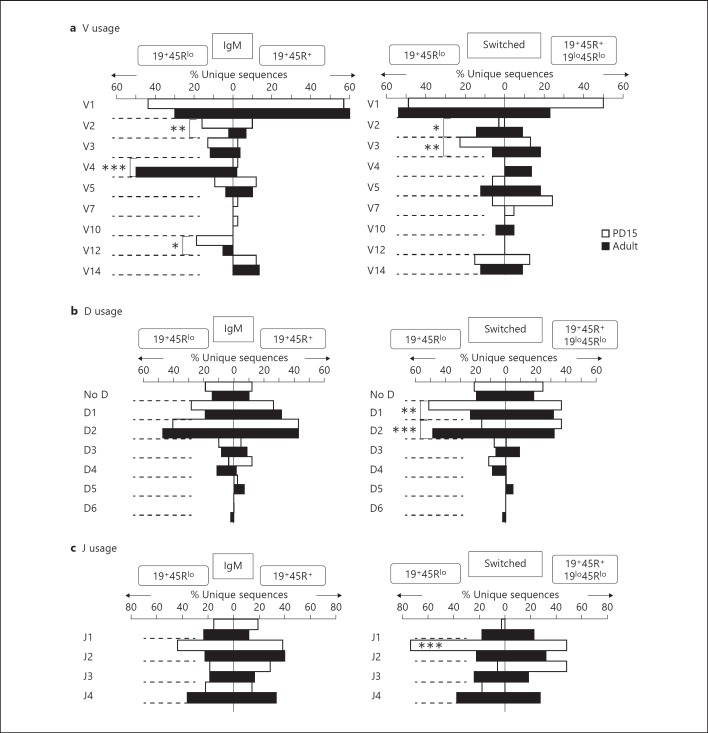
Fig. 2.
Analysis of the IgH repertoires expressed by 19+45Rlo, 19+45R+ and 19lo45Rlo cells. Sorted PD15 and PD60 samples were examined by RT-PCR isotype-specific amplification as in fig. 1c. The procedure for cloning and sequencing has been described in Materials and Methods. The results for IgM and switched (IgG1 and IgA) sequences are represented as percentages of the unique sequences (white bars, PD15 sequences; black bars, PD60 sequences). The data shown on the left correspond to the sequences from 19+45Rlo cells, while those on the right correspond to 19+45R+ cells (PD15 and PD60 IgM and PD15 switched sequences) and 19lo45Rlo cells (PD60 switched sequences). The total numbers analysed are indicated in table 1. a V region family usage. b D region usage. c J region usage. Statistical analysis was performed using the χ2 test comparing the groups indicated by the brackets. J region use comparison was performed in a contingency table of the 4 J regions among the different groups. * p < 0.05, ** p < 0.01, *** p < 0.001: represents statistical significance.

