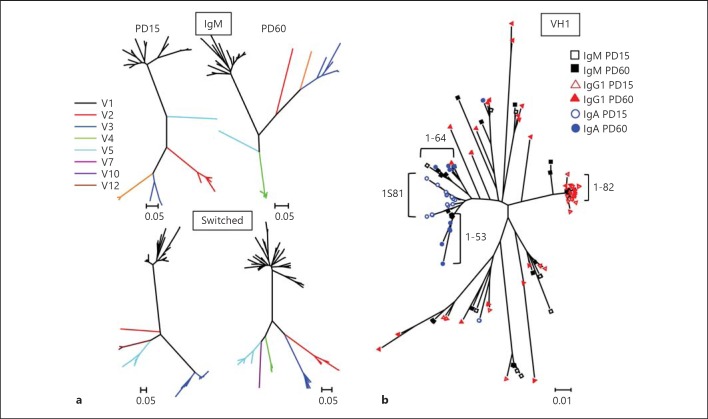
Fig. 3.
Phylogenetic trees of the sequences from 19+45Rlo cells. Sequences were analysed using the BioEdit and MEGA5 software. a The phylogenetic relationship is shown for the IgM (upper trees) and switched (bottom trees) sequences from PD15 and PD60 19+45Rlo cells. b Overlaid analysis of the V1 family results for the IgM and switched sequences from PD15 and PD60 19+45Rlo cells. Black squares indicate IgM, red triangles indicate IgG1 and blue circles show IgA sequences (PD15 and PD60 samples are shown as empty and filled symbols, respectively). Bars represent the nucleotide substitutions per site.

