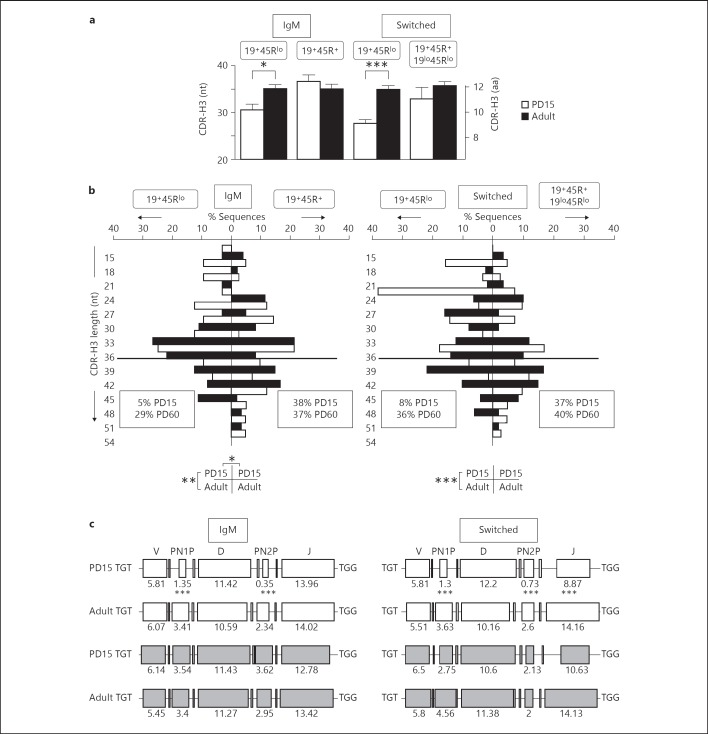
Fig. 4.
Analysis of the CDR-H3 region of IgM and switched sequences. nt = Nucleotides; aa = amino acids. a Average length (±SEM) of the CDR-H3 segment. Left scale is in nucleotides and right scale in amino acids from PD15 (white bars) and PD60 (black bars) sequences. Significance was calculated using an unpaired two-tailed Student t test. * p < 0.05, *** p < 0.001. b Length distribution (in nucleotides) of the unique and functional sequences analysed. The results are displayed as in figure 2 and the statistical analyses were performed using the χ2 test for contingency tables as indicated below the histograms. * p < 0.05, ** p < 0.01, *** p < 0.001. The frequencies of sequences larger than 36-nucleotide sequences are boxed (this limit is indicated by the thick horizontal line). c Deconstruction of the components of the CDR-H3 segment in sequences containing identifiable D regions. Sequences from 19+45Rlo cells are shown in white and those from 19+45R+/19lo45Rlo cells in grey. The numbers indicate the average length of each segment in nucleotides. Comparisons among the values were performed using an unpaired two-tailed Student t test. *** p < 0.001.

