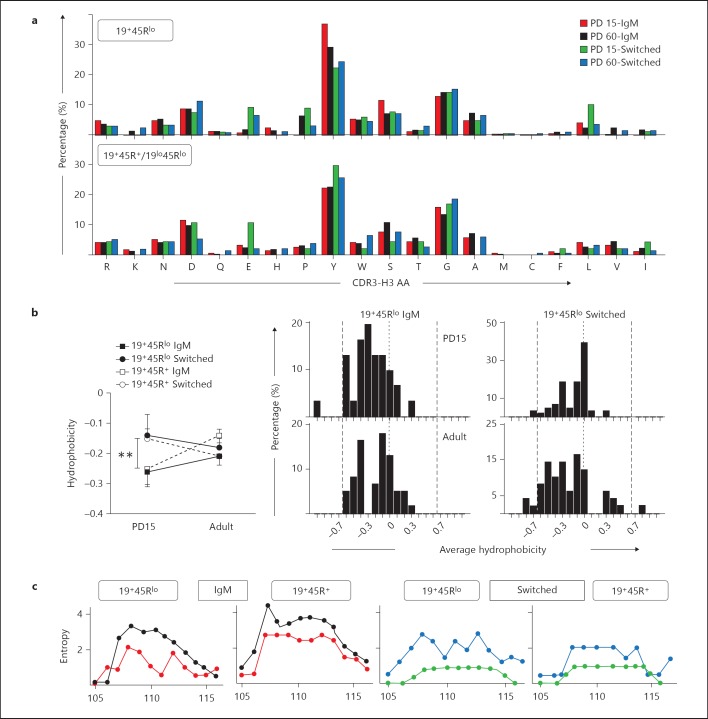
Fig. 5.
Amino acid frequencies, hydrophobicity and variability profiles of the CDR-H3 region. The CDR-H3 loop was defined by amino acids 107-114, according to the IMGT unique numbering system. a Overall amino acid frequency distributions in the CDR-H3 loop of the indicated samples. Amino acids are arranged by polarity from arginine (left) to isoleucine (right). PD15 IgM sequences (red), PD60 (black), PD15 switched sequences (green) and PD60 switched (blue). b Left: average hydrophobicity of the CDR-H3 loop from the groups shown in the figure was calculated using the normalized Kyte-Doolittle index [37]. Right: histograms show the hydrophobicity distribution profile of the CDR-H3 loop of the indicated 19+45Rlo sequences. The dashed vertical lines mark the preferred range in average hydrophobicity described for Hardy's fraction F [20]. The dotted lines indicate the zero value. p values were calculated using the unpaired two-tailed Student t test. ** p < 0.01. c CDR-H3 region variability represented by the Shannon entropy [21] was calculated for each position using the 12 amino acid long CDR-H3 sequences (positions 105-117). Overlaid representations of the PD15 and PD60 results are shown for the groups indicated. The colour code is as in a.

