Fig. 1.
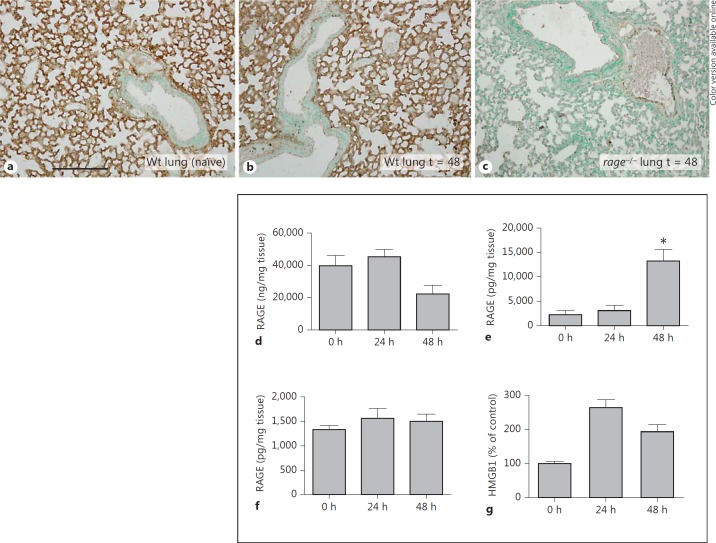
Expression of RAGE in mouse organs and of its ligand HMGB1 in plasma after systemic pneumococcal infection. a Representative picture of a lung sample from a normal, uninfected Wt mouse, displaying extensive RAGE staining. b Lung sample from a Wt mouse 48 h after intravenous injection of 5 × 10⁵ CFU of S. pneumoniae. c Absence of RAGE positivity in the lung of a rage−/− mouse. Scale bar = 200 μm. RAGE concentrations in lungs (d), spleens (e) and livers (f) from naïve Wt mice and 24 and 48 h after intravenous injection of 5 × 10⁵ CFU of S. pneumoniae (5-8 mice per group at each time point). * p < 0.05 versus naïve mice (0 h). g Densitometric analysis of HMGB1 blot expressed as a percentage of the mean density measured in naïve control plasma samples. HMGB1 detection was enhanced at 24 and 48 h compared to naïve control samples (0 h; n = 3 per time point). Bars represent mean ± standard error of the mean.

