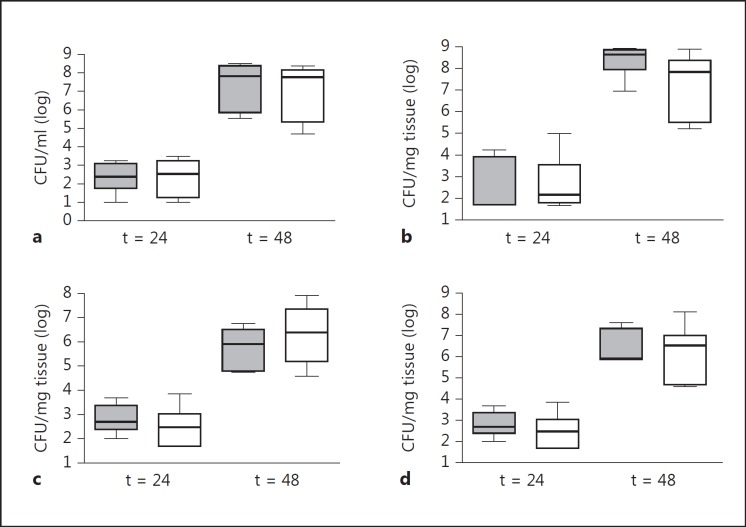
Fig. 2.
Wt and rage−/− mice display similar bacterial outgrowth after systemic infection with S. pneumoniae. Bacterial loads in the blood (a), lung (b), spleen (c) and liver (d) after intravenous injection of 5 × 10⁵ CFU of S. pneumoniae in Wt (grey) and rage−/− mice (white). Data are expressed as box-and-whisker diagrams depicting the smallest observation, lower quartile, median, upper quartile and largest observation (n = 5-8 mice per group at each time point).

