Figure 1.

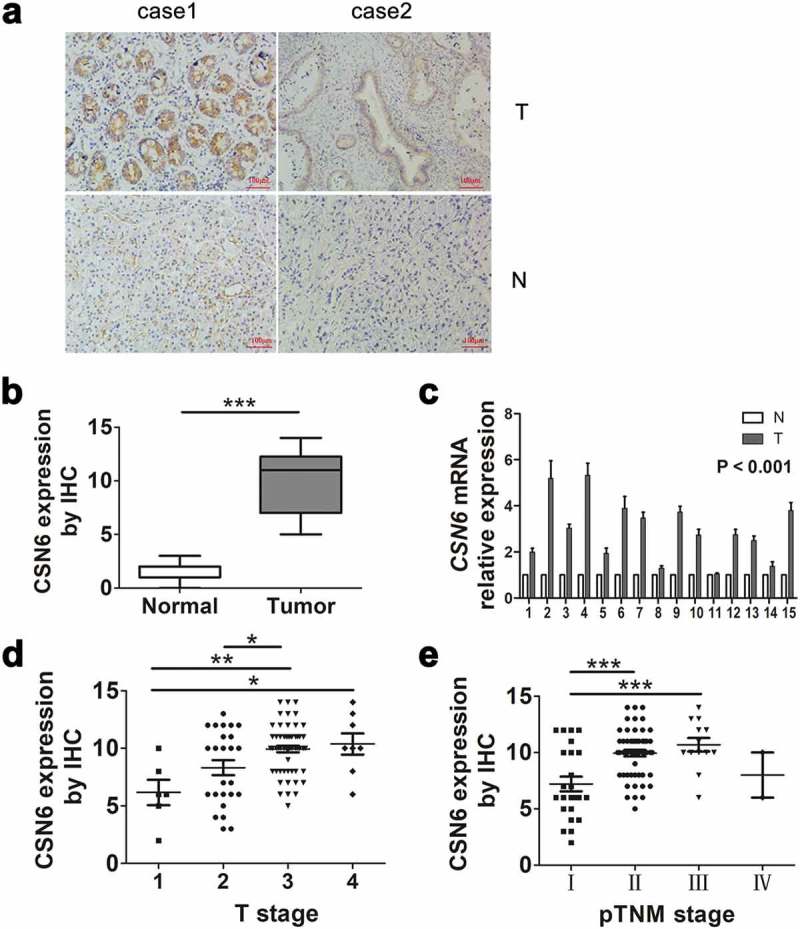
CSN6 protein expression is significantly higher in PDAC tissues than in adjacent non-cancerous tissue. a CSN6 expression in cancer tissues and adjacent non-cancerous tissue (magnification, 200×); T CSN6 expression in PDAC tissues, N CSN6 expression in adjacent non-cancerous tissues. b CSN6 IHC score in cancer tissues and adjacent non-cancerous tissues. c Fifteen representative paired samples of PDAC tissue (T) and adjacent normal tissues (N) were used for real-time qPCR analysis, and CSN6 expression levels were higher in 15 representative paired PDAC samples (p < .001). d The expression of CSN6 in each T stage (tumor infiltration) of PDAC patients (n = 94; T1, n = 6; T2, n = 25; T3, n = 55; T4, n = 8). e The expression of CSN6 in each pTNM stage of PDAC patients (n = 94; Ι, n = 24; ΙΙ, n = 55; ΙΙΙ, n = 12; ΙV, n = 3). Four groups of data were analyzed using ANOVA with post-test. PDAC, pancreatic ductal adenocarcinoma; CSN6, constitutive photomorphogenesis 9 (COP9) signalosome 6; qPCR, quantitative real-time PCR; IHC, immunohistochemistry. *P < .05; **P < .01; ***P < .001.
