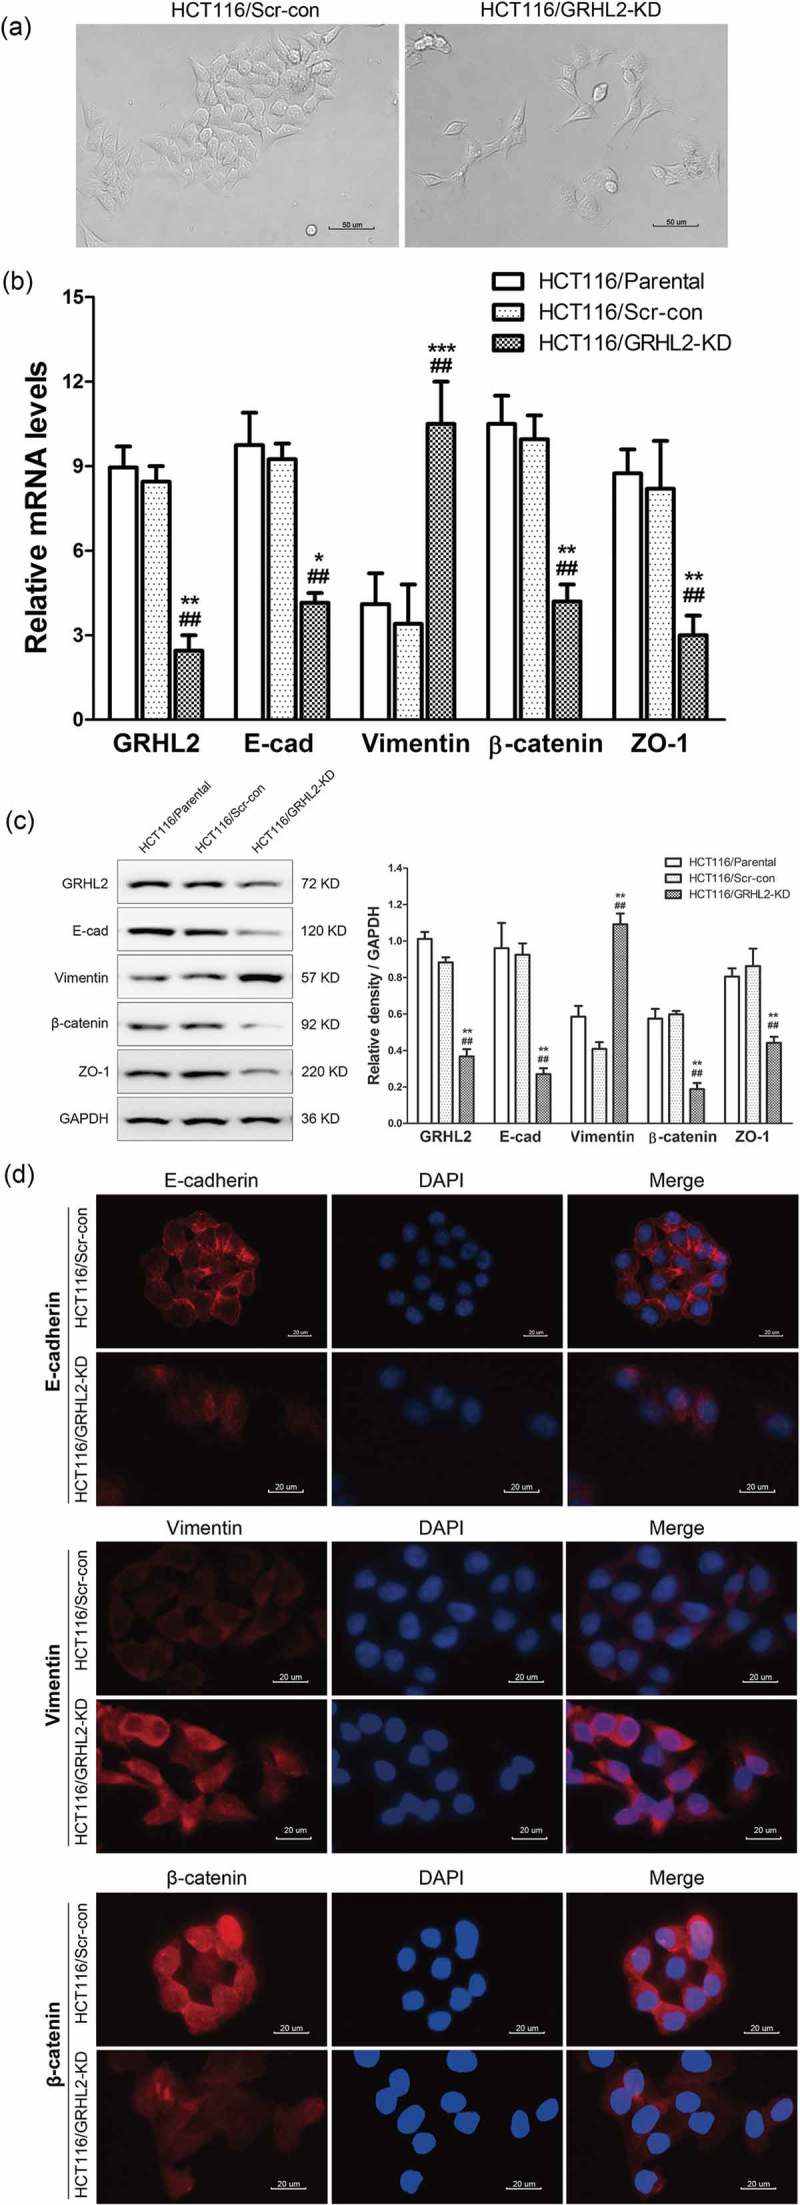
Figure 3.

A. GRHL2 knockdown induced HCT116 EMT morphology change. B. qRT-PCR analysis of EMT marker gene expression in GRHL2 knockdown cells. C. WB analysis of EMT marker proteins in GRHL2-knockdown cells. D. IF analysis of EMT marker proteins in GRHL2-knockdown cells. *relative to HCT116/Scr-con control *p < 0.05, **p < 0.01, ***p < 0.001; #relative to HCT116/Parental control #p < 0.05, ##p < 0.01.
