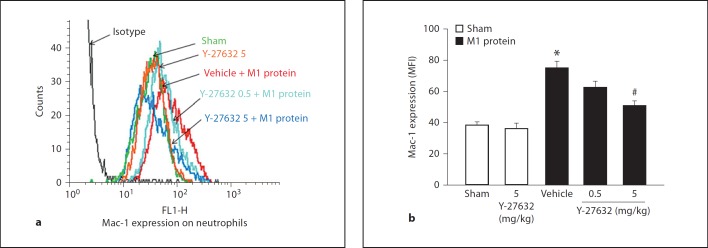
Fig. 4.
Representative histogram from 5 samples: Rho-kinase regulates M1 protein-induced Mac-1 expression on neutrophils in vivo. Mac-1 expression on neutrophils in vehicle-treated (PBS) or Y-27632-treated (0.5 or 5 mg/kg) animals 4 h after M1 protein injection is shown. MFI is shown on the x-axis and cell counts on the y-axis. Data represents mean ± SEM, * p < 0.05 versus sham and # p < 0.05 versus vehicle + M1 protein, n = 5.

