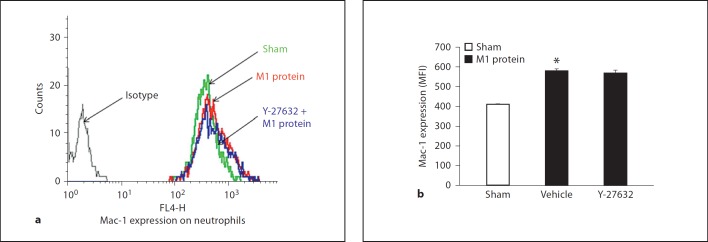
Fig. 5.
Representative histogram from 5 samples: Mac-1 expression on neutrophils in vitro. Whole blood was incubated with PBS only, or M1 protein (1 µg/ml) and vehicle (PBS) or Y-27632 (10 µM). Samples were harvested 4 h after M1 protein challenge. MFI is shown on the x-axis and cell counts on the y-axis. Data represents mean ± SEM, * p < 0.05 vs. Sham and # p < 0.05 vs. Vehicle + M1 protein, n = 5.

