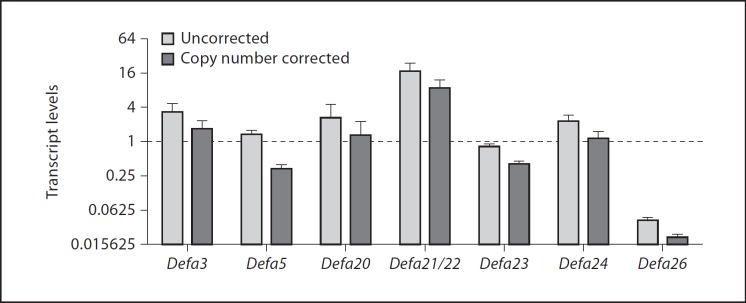
Fig. 1.
Paneth cell Defa genes are not equally expressed. Ileal transcript levels of Defa genes in C57BL/6 mice, relative to the transcript levels of the Rplp0 gene (defined as 1, dashed line). Open bars represent the overall relative expression for each subgroup. Solid bars represent relative expression of each individual gene within a subgroup (this was arbitrarily calculated by dividing the overall relative expression of the subgroup by the number of genes within the subgroup; this correction assumes equal expression between the members of each independent subgroup; 2 genes for Defa3, 20, 21/22, 23, 24 and 26, and 4 genes within the Defa5 group). Data shown are medians and ranges from the average of two qPCRs; n = 5 animals per group.

