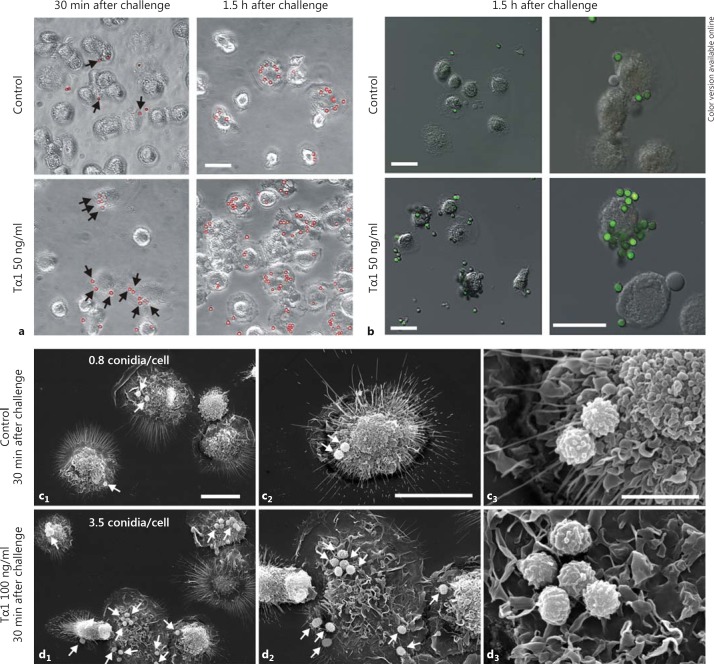
Fig. 3.
Effect of Tα1 on the interactionof A. niger conidia with human MDMs. a Phase-contrast microscopy of control and Tα1-treatedMDMs, 30 min and 1.5 h after challenge, showing the interaction with conidia, which were pseudocolored red using the Corel Photo Paint software to enhancecontrast. Bar = 20 µm. b Confocal microscopy images of A.niger conidia, which were stained with Alexa Fluor 488 succinimidyl ester (green hue); merged images with differential interference contrast to visualize cell morphology are shown. Bars = 20 µm. c, d SEM of untreated (c) and Tα1-treated MDMs (d) 30 min after challenge showing interaction with A. niger conidia (arrows). The mean number of adhering conidia on the cell surface for each sample is also reported; quantitative assessment was performed by analyzing, in a blinded fashion, a minimum of 100 cells per sample, and results were expressed as the mean values of three different experiments. Bars = 20 (c1, d1, c2, d2) and 5 µm (c3, d3). (Colors are available in the online version only.)

