
Figure 5.
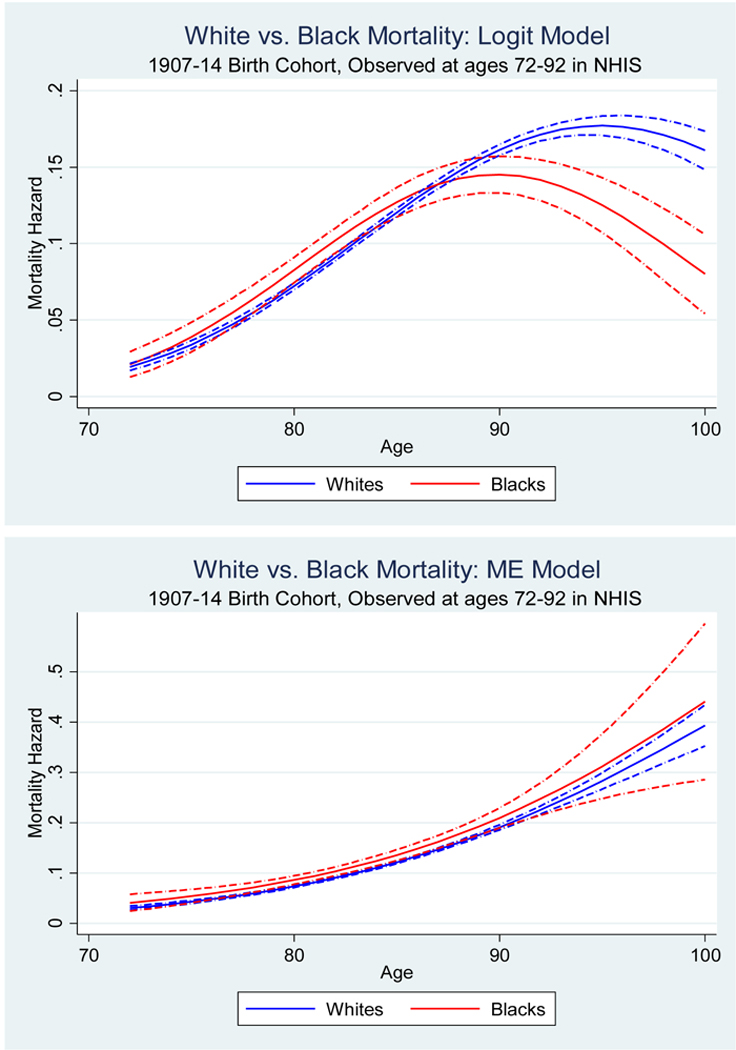
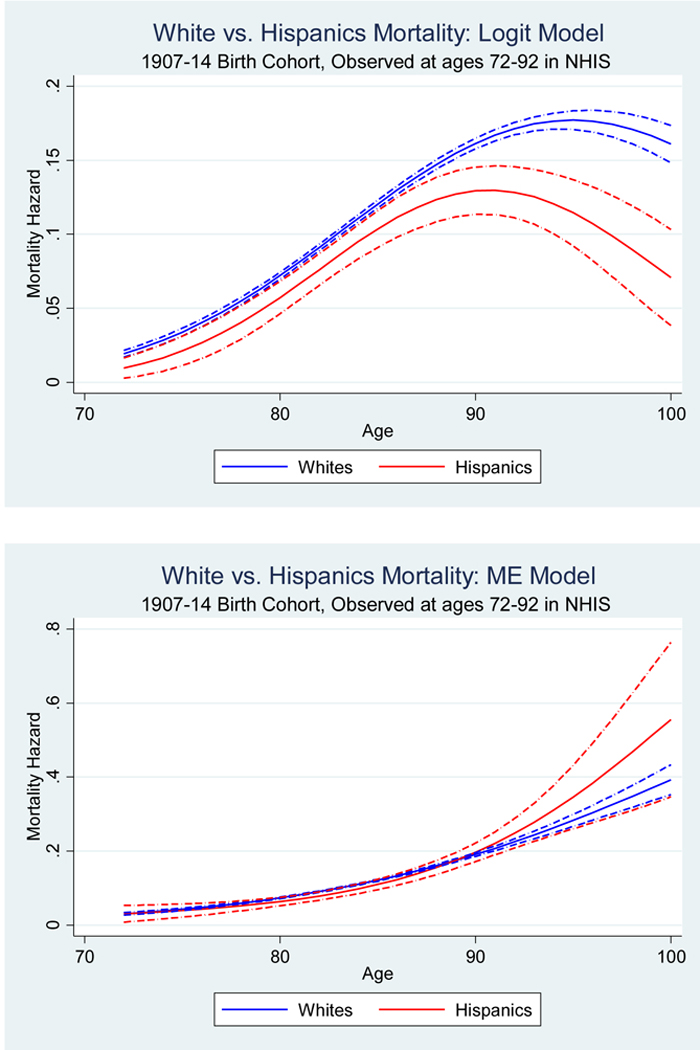
Evidence on the black-white mortality crossover and Hispanic paradox in the naïve logit model and measurement error-corrected model, NHIS-NDI data
Panel A The black-white mortality crossover
Note: The dashed-dot lines represent 95% confidence intervals.
Panel B The Hispanic paradox
Note: The dashed-dot lines represent 95% confidence intervals.