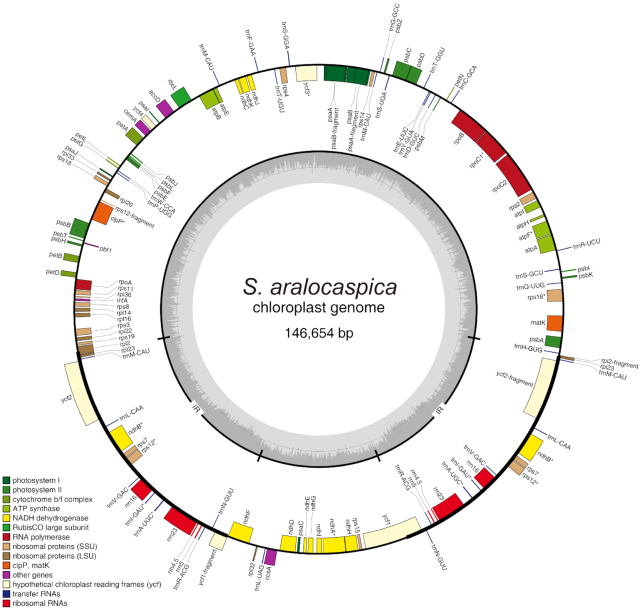
Figure 3:
Gene map of the S. aralocaspica chloroplast genome. Genes shown outside the outer circle are transcribed clockwise, and those inside are transcribed counterclockwise. Genes belonging to different functional groups are color coded. The dashed area in the inner circle indicates guanine-cytosine content of the chloroplast genome.

