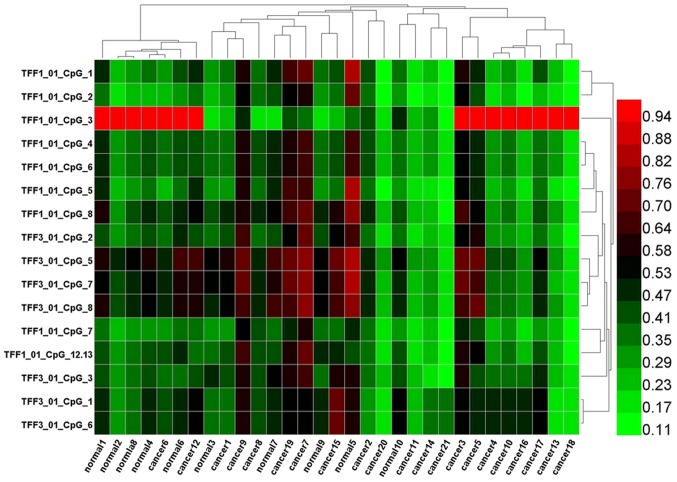
Figure 3.
Two-way hierarchical cluster analysis of 21 cancer tissue and 10 normal tissue samples (columns) and DNA-methylation of CpG Units in promoter regions (rows). DNA-methylation levels are depicted in this heatmap on a continuous scale from light green (unmethylated) to light red (100% methylated). Poor quality data is shown in black. Less-dominant clustering was found in cancer or normal tissues. The hierarchical cluster algorithm could not separate colon cancer samples from normal tissue samples.

