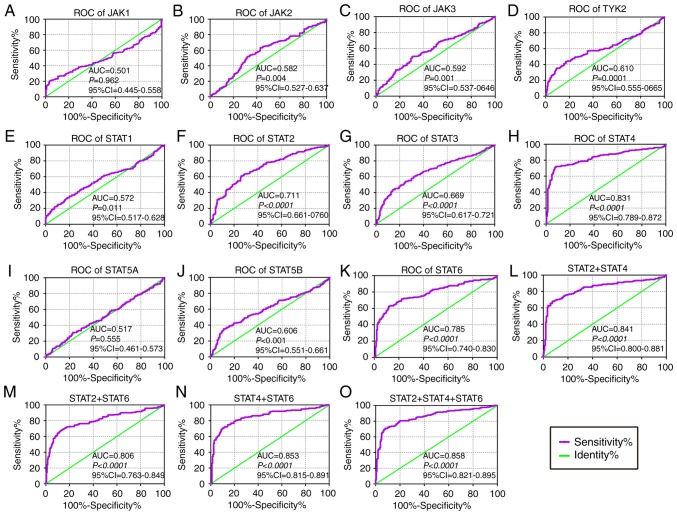
Figure 2.
Diagnostic ROC curves of key genes of JAK/STAT pathway using the GSE14520 dataset. ROC curves of JAK/STAT pathway members: (A) JAK1, (B) JAK2, (C) JAK3, (D) TYK2, (E) STAT1, (F) STAT2, (G) STAT3, (H) STAT4, (I) STAT5A, (J) STAT5B and (K) STAT6. ROC curves of combinations: (L) STAT2 + 4, (M) STAT2 + 6, (N) STAT4 + 6 and (O) STAT2 + 4 + 6, respectively. ROC, receiver operating characteristic; AUC, area under the curve; CI, confidence interval; JAK, Janus kinase; TYK2, tyrosine kinase 2; STAT, signal transducer and activator of transcription.

