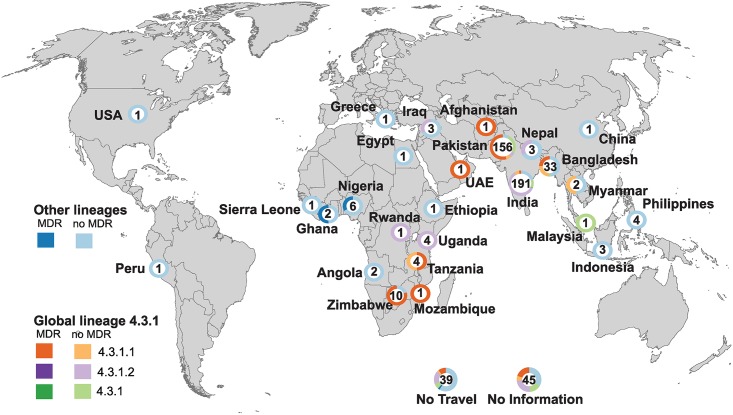
Fig 3. Geographic distribution of S. Typhi based on reported country of travel.
S. Typhi isolates with completed travel questionnaires and reporting travel to only one country are shown. The number in each circle indicates the total number of cases reporting travel to that country, circle graphs indicate the genotype composition of the corresponding S. Typhi isolates, stratified by MDR, coloured as per inset legend. Blank map sourced from https://commons.wikimedia.org/wiki/File:BlankMap-FlatWorld6.svg

