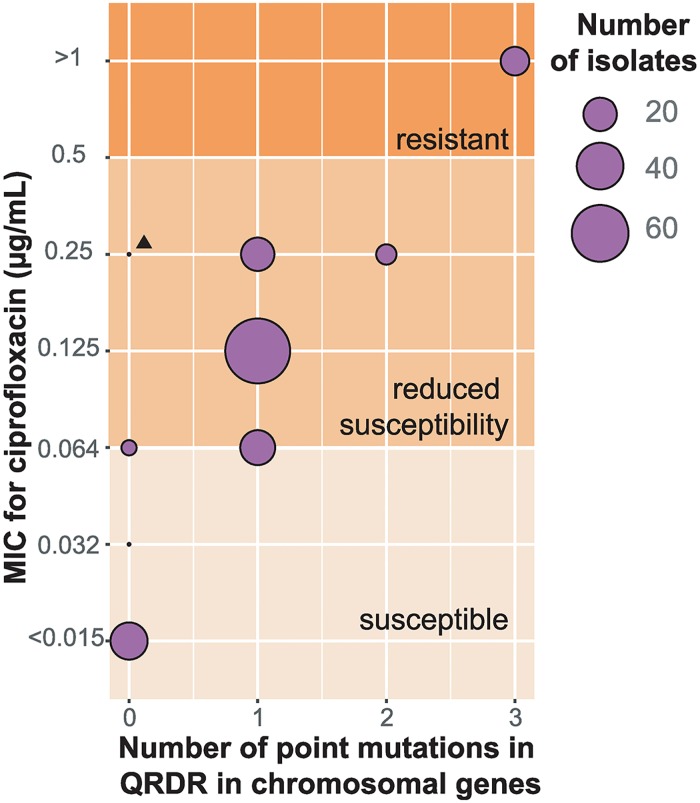
Fig 4. Minimum inhibitory concentration (MIC) for ciprofloxacin versus number of point mutations in QRDRs in two chromosomal genes.
The number of isolates with different combinations of MIC values and point mutations detected in the QRDRs of two chromosomal genes, gyrA and parC, are shown. The breakpoints of susceptible, reduced susceptibility and resistance are shown by the background gradient of the plot. The triangle indicates an isolate that carries qnrS-1.

