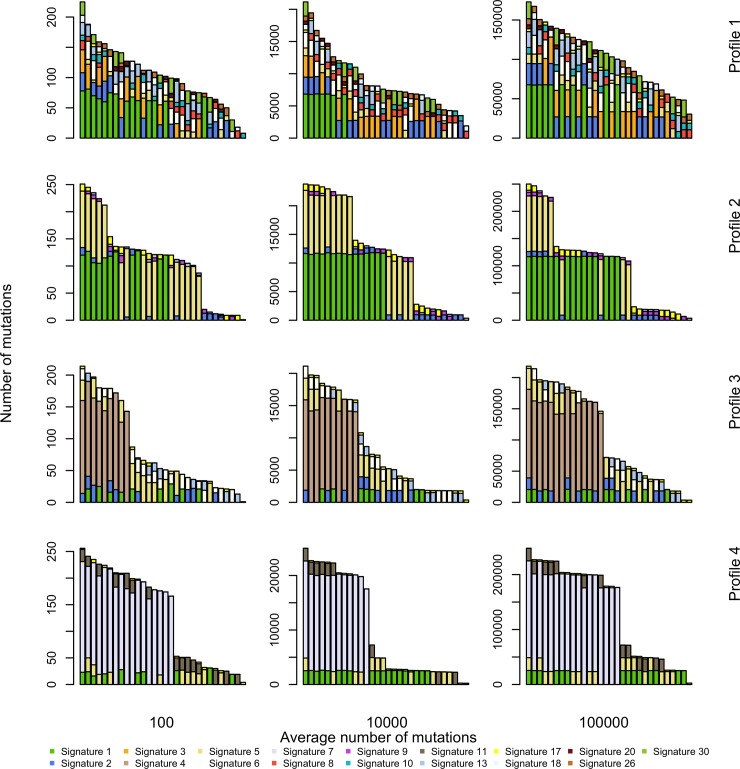
Fig 2. Sample of simulated catalogues.
Catalogues are simulated according to the model described in the text. Tuning parameters are the average number of mutations, here r = 102,104 and 105, and the cancer type-specific average contribution of each signature (also see S4 Fig). Coloured bars indicate the contribution of each signature to the total mutational load of each sequence.

