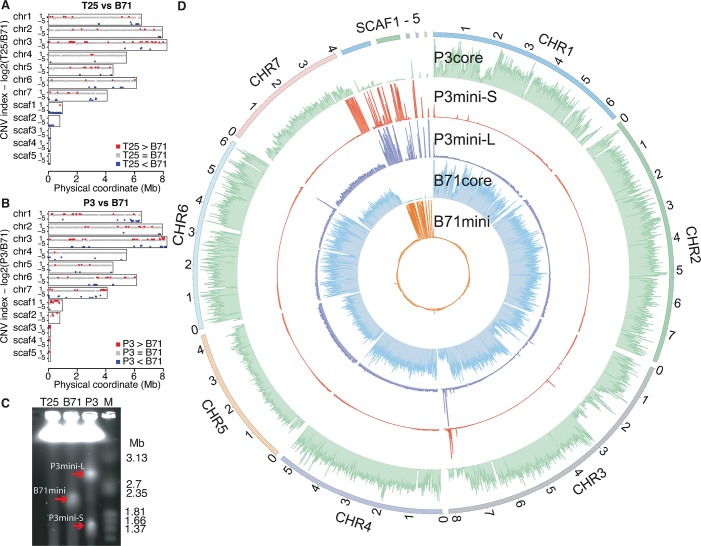
Fig 4. Genome comparison and mini-chromosomes.
(A,B) Comparisons of T25 versus B71 (A) and P3 versus B71 (B). CNV index (y-axis) represents the log2 value of the ratio of read counts of a genomic segment between two isolates. Red, blue, gray lines represent CNplus, CNminus, and CNequal, respectively. (C) CHEF gel of three MoT isolates. Red arrows indicate mini-chromosomes. (D) Genome-wide distributions of read depths of 10kb bins, determined by uniquely-mapped reads, from sequencing of gel-excised core or mini-chromosomes. The 99.5% percentile of read depths per bin sets track height.

