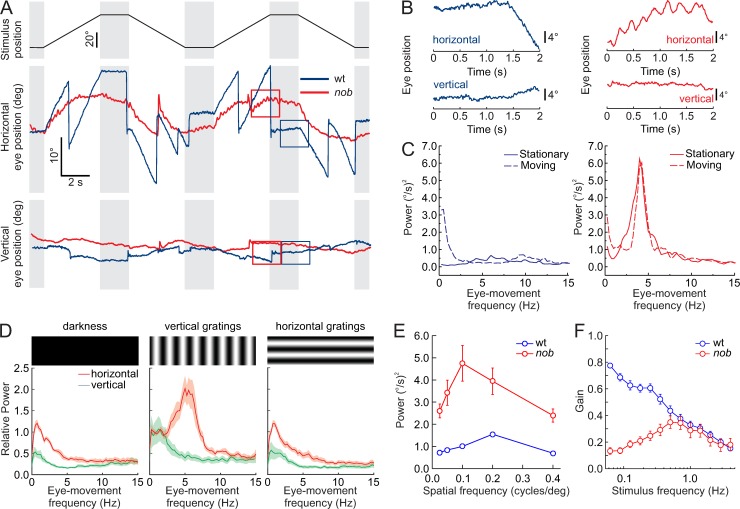
Fig 1. Horizontal eye movements are disturbed in nob mice.
(A) Schematic diagram of the timing of the stimulus used to evoke eye movements: 0.1 cycle/deg sine wave grating stimulus of 90% contrast moving at 10 deg/s (Top panel). Raw horizontal (middle panel) and vertical (bottom panel) eye movements are compared for wt (blue lines) and nob (red lines) mice. All nob mice tested behaved similarly (n = 9). (B) Two-second segments taken from the boxes in (A), on an expanded scale, show small-amplitude oscillating eye movements in nob (right) but not in wt (left) mice. These 2-s segments illustrate that wt mice made smooth eye movements in the presence of the moving contrast, whereas the eyes of nob mice oscillated in the horizontal direction. In both wt and nob mice, vertical eye movements were generally absent. (C) Power spectral density plots of the eye-movement velocity show an approximately 5-Hz oscillation frequency in nob mice (right) during moving and stationary stimuli, whereas the eyes of wt mice (left) did not oscillate under those conditions. The peak in the power spectrum for the moving stimulus (0.5 Hz) in wt results from stimulus-induced eye movements. (D) Relative power spectral density plots comparing nob eye movements (n = 9) in darkness (left panel), during vertical sine grating presentation (middle panel), and during horizontal sine grating presentation (right panel). A vertical grating with a spatial frequency of 0.1 cycles/deg effectively induced eye-movement oscillations, whereas a horizontal grating of the same spatial frequency did not. (E) The relation between spatial frequency and power of the eye-movement oscillations in the same mice. A spatial frequency of 0.1 cycles/deg was the most effective. Oscillating eye movements were absent in wt mice (n = 9). (F) Frequency-response plots of the OKR, tested by projecting a horizontally oscillating dot pattern (peak velocity of 18.85 deg/s) on a screen around the mouse. The eye-movement gain is expressed as the average velocity amplitude of the eye-movement response divided by the velocity amplitude of the stimulus. In wt mice (blue line; n = 11), the gain drops with increasing oscillation frequency. The eye-movement gain of nob mice (red line; n = 9) deviates from that of wt at low frequencies. Data in (D-F) are shown as mean ± SEM. The data underlying this figure can be found at https://figshare.com/account/home#/projects/65990. OKR, optokinetic response; wt, wild type.

