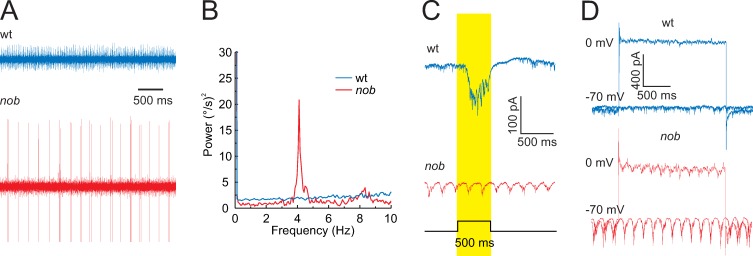
Fig 2. nob mice GC oscillate.
(A) Optic nerve recordings of spontaneous GC spiking activity in wt and nob mice after 30 min of dark adaptation. The spontaneous activity of nob GCs shows oscillatory spiking patterns with a mean frequency of 4.79 ± 0.13 Hz (n = 46 isolated units). (B) In this example, the GC fundamental frequency is 4 Hz. (C) GFP-positive cells in wt/SPIG1+ mice show an increased inward current during a light flash, e.g., an ON response (blue trace). In nob/SPIG1+ mice, GFP-positive GCs lack a light-evoked inward current and show oscillating inward currents. (D) Inhibitory and excitatory currents in GFP-positive wt/SPIG1+ (blue) and nob/SPIG1+ (red) GCs recorded under voltage-clamp conditions (holding potential: 0 and −70 mV, respectively). In nob mice, both excitatory and inhibitory inputs oscillated with a mean frequency of 5.10 ± 0.22 Hz (n = 36) and 4.50 ± 0.38 Hz (n = 8), respectively. The data underlying this figure can be found at https://figshare.com/account/home#/projects/65990. GC, ganglion cell; GFP, green fluorescent protein; SPIG1, SPARC-related protein-containing immunoglobulin domains 1; wt, wild type.

