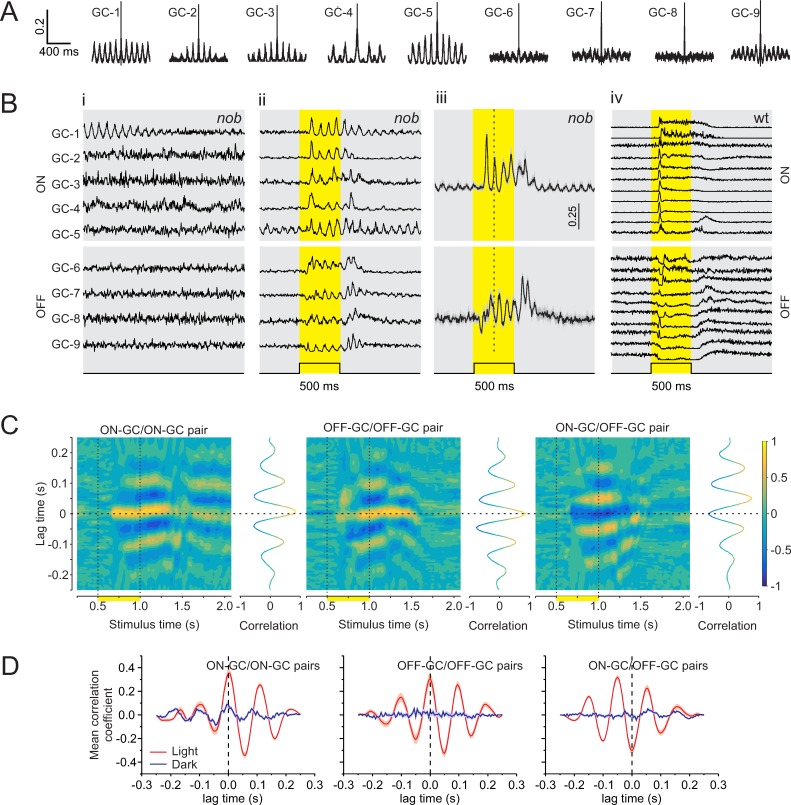
Fig 3. In the dark, nob mice GCs oscillate asynchronously, but light stimulation synchronizes their oscillations.
Results based on GC spiking responses recorded on an MEA. (A) Autocorrelations of 9 representative nob GCs from one retina in the dark. Periodic variations in their autocorrelations indicate spontaneous oscillatory activity. (Bi) Each trace shows the mean normalized GC activity of 100 episodes of activity in the dark during the first 2 s of a 5-s window. All episodes were aligned to the first spike in the corresponding episode of GC-1 and then averaged. A clear oscillatory pattern is initially apparent for GC-1. In contrast, none of the other cells showed a similar pattern, suggesting that each nob GC oscillated with a frequency and/or phase, independent of GC-1. (Bii) Mean normalized activity of the same nob GCs in response to a 500-ms light flash (yellow shading). Note the presence of oscillation in all GCs, indicating that their phase was reset by the light flash. (Biii) Mean (± SEM) light-evoked oscillations of GCs could be separated into two clusters that oscillated in antiphase with each other. One cluster showed a decrease in spike rate just after light onset identifying them as OFF-GCs (bottom; n = 10), whereas the other cluster responded with a delay and in antiphase, suggesting they were ON-GCs (top; n = 13). (Biv) Mean responses of 21 wt GCs to the same stimulus used in (Bii-iii) show no oscillatory activity evoked by the light flash. (C) Short-time cross-correlations between mean responses of representative nob ON-GC/ON-GC, OFF-GC/OFF-GC, and ON-GC/OFF-GC pairs during the same light stimulation. Line graphs flanking the heat maps (3D plots) show the cross-correlation for a time window of 250 ms, advancing in 25-ms steps. After light onset, and around zero lag time, peak-positive correlation coefficients are found for nob ON-GC/ON-GC and OFF-GC/OFF-GC pairs and peak-negative correlation coefficients for the ON-GC/OFF-GC pair. (D) Mean (± SEM) cross-correlations of all nob ON-GC/ON-GC (n = 78), OFF-GC/OFF-GC (n = 45), and ON-GC/OFF-GC (n = 130) pairs for nob GCs used in (Biii). Two time windows are illustrated. The blue line indicates a window immediately prior to light onset (250–500 ms); the red line indicates a window during the light flash (675–925 ms). Panels C and D show that the oscillations are poorly synchronized in the dark before the light flash and that light synchronizes the oscillations, which gradually dissipates again in the dark after the light flash. The data underlying this figure can be found at https://figshare.com/account/home#/projects/65990. GC, ganglion cell; MEA, multielectrode array; wt, wild type.

