Fig. 10.
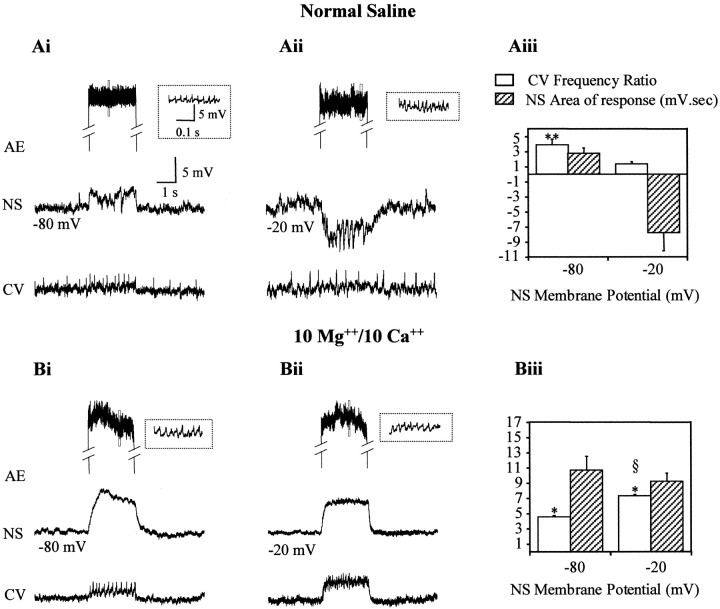
NS neurons regulate the coupling between motoneurons. Paired recordings of an NS neuron and a CV motoneuron during the stimulation of a local AE motoneuron with a square current step. Only the part of the recording corresponding to the stimulus is shown for the AE motoneuron. The inset shows the fragment of the recording indicated by the dotted rectangle in an expanded temporal scale. A, Representative recordings in normal saline as the membrane potential of the NS neuron was set at −80 mV (Ai) or at −20 mV (Aii). The membrane potential of the CV motoneuron was manipulated by injecting DC current to obtain a similar spontaneous firing rate in both conditions. B, Experiments performed in a high divalents solution (10 mmMg2+/10 mm Ca2+) as the membrane potential of the NS neuron was set at −80 mV (Bi) or −20 mV (Bii). Thegraphs show the change in frequency of the CV motoneuron (white columns) and the time integral (area) of the response of the NS neuron (striped columns) for experiments performed in normal (Aiii) and high divalents solution (Biii). The increase in frequency of the CV motoneuron during the injection of current in the AE motoneuron was measured as fp/fo, where fp is the firing frequency during the pulse and fo is the basal firing frequency, measured for 13 sec before the stimulation step. The time integral was measured during a period of 4 sec from the beginning of the pulse. The columns and error bars indicate mean and SEM, respectively (n = 3 for eachcolumn). The magnitude of both parameters is expressed using the same y-scale, with the appropriate units specified in column references. *p < 0.01 and **p < 0.001 (compared with the corresponding basal frequency); § p < 0.01 (compared with the value at −80 mV). Statistical analysis used ttests

