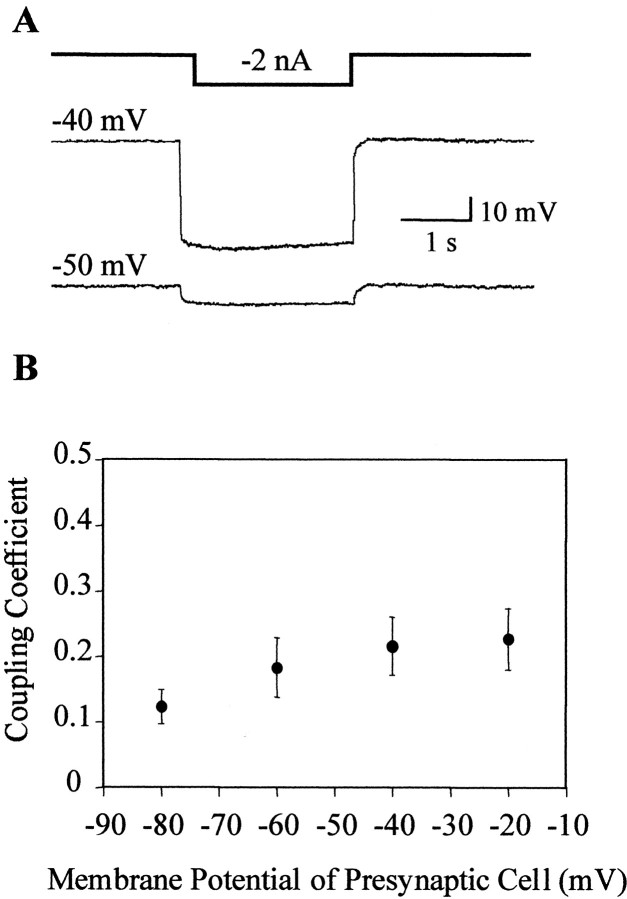
Fig. 3.
Coupling between pairs of NS neurons as a function of the membrane potential. A, Representative recordings showing the responses of a pair of NS neurons to a current step injected into one of them (represented by the square step line on top). We define the injected NS neuron as presynaptic (top trace) and the second NS neuron as postsynaptic (bottom trace). The membrane potential at which the cells were set is indicated on the left of each trace. B, The graph displays the coupling coefficient between pairs of NS neurons as a function of the membrane potential of the presynaptic neuron. The presynaptic cell was shifted to different membrane potentials, whereas the postsynaptic NS neuron was set at −50 mV. The symbols and error bars indicate mean and SEM, respectively (n = 7). Statistical analysis used two-factor ANOVA with repeated measures.

