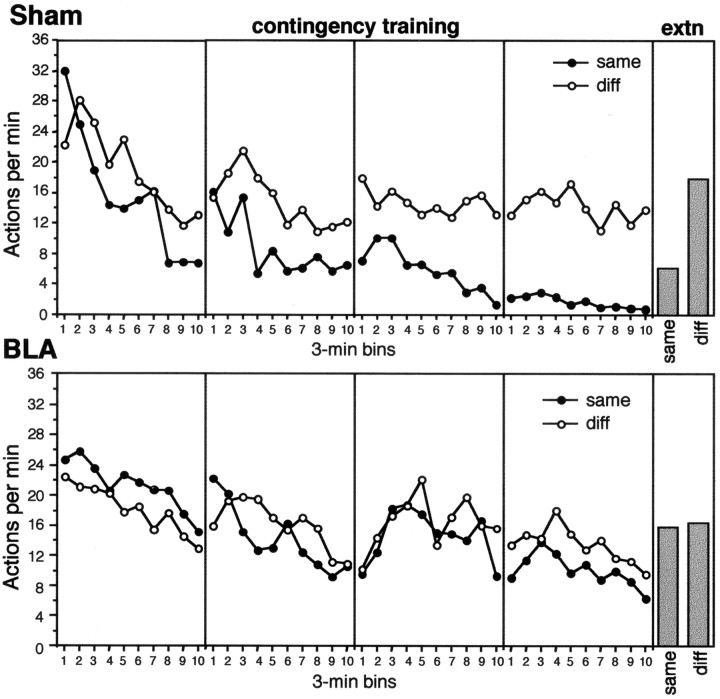
Fig. 5.
Experiment 2: mean performance of lever press and chain pull actions per minute, averaged over 3 min bins, during each of the 4 d of contingency assessment (left four panels) and during the extinction test (right panel). Test performance is divided into two panels: thetop panels show the data from group Sham and thebottom panels show the data from group BLA. In this figure, performance of each action is presented separately in each panel according to whether the action-outcome contingency has been degraded, i.e., the outcome delivered by performing the action is the same as the one now delivered without performing the action (same, ●), or has not been degraded, i.e., the outcome delivered by performing the action differs from that delivered without performing the action (diff, ○). In the panel illustrating the extinction test (extn), the previously degraded action-outcome contingency remains designated assame and the nondegraded as diff, although no outcomes were presented in this test.

