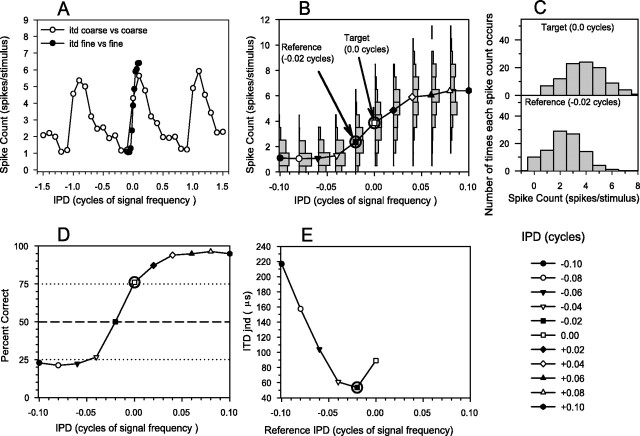
Fig. 1.
Illustration of ROC analysis.A, Tone delay function using coarse steps (○) and fine steps (●). B, Segment of fine-step tone delay function (joined circles) with distribution of number of times each spike count occurred superimposed. An example reference (−0.02 cycles) and target (−0.00 cycles) ITD arecircled and illustrated with arrows.C, Distributions for example reference and target ITDs replotted. D, “Neurometric” function showing predicted percentage correct in a simulated 2IFC experiment (see Materials and Methods, ROC analysis, for details). The circled point shows the percentage correct for the example target ITD of −0.0 cycles. E, ITD jnd as reference ITD is varied. The circled point shows the example reference ITD of −0.02 cycles.

