
Fig. 4.
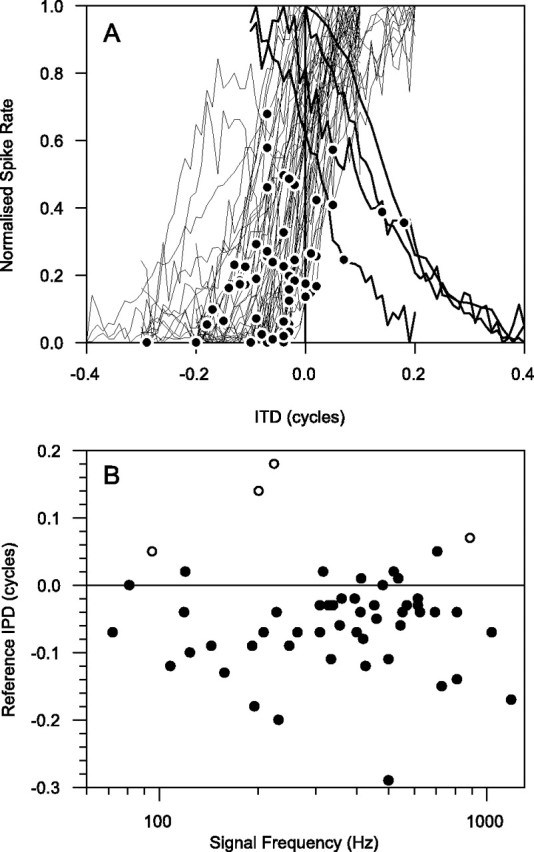
A, Fine ITD curves for all units plotted over each other after normalizing by subtracting off the minimum rate and dividing by the resulting maximum. The position of the reference point for the best jnd is shown on each curve by afilled circle. Four units had ipsilateral peaks and slope the opposite way to the other curves. B, Positions of the reference points. Points from units where the peak of the ITD curve was contralateral are shown as filled circles, and where the peak was ipsilateral they are shown as open circles.