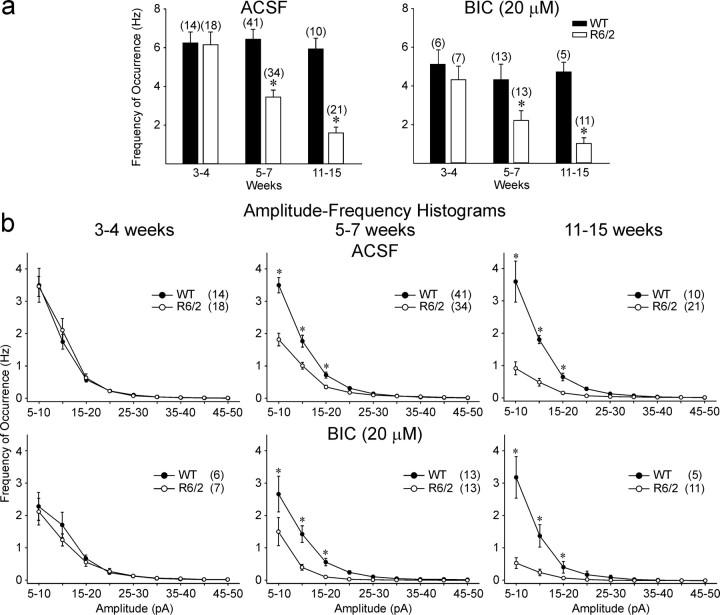
Fig. 2.
a, Changes in mean frequency of occurrence of total events from WT and R6/2 transgenics in ACSF (left) and in the presence of BIC (right). In this and other figures, error bars are SE, and n values for each group are abovebars or in parentheses. b, Amplitude–frequency histograms for ACSF and BIC indicated that the primary differences in frequency were attributable to a reduction in currents in the 5–20 pA range. Asterisks in this and other figures indicate that differences between WT and R6/2 means were statistically significant.

