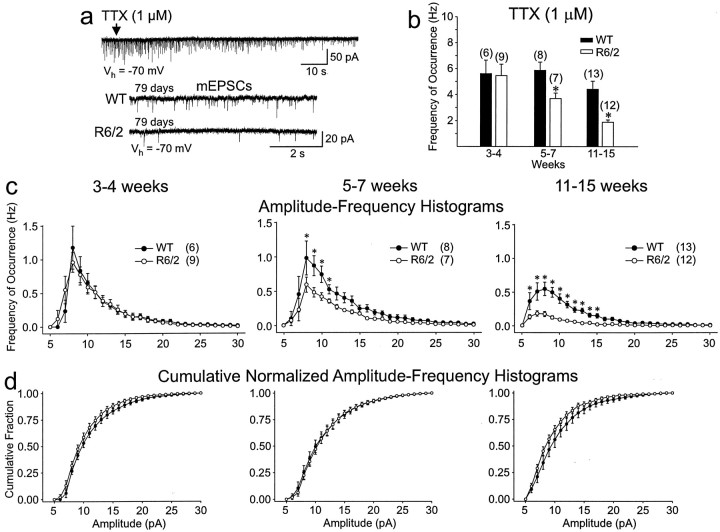
Fig. 4.
a, TTX (1 μm;top trace at arrow) isolated the mEPSCs.Bottom two traces show comparison of the frequency of mEPSCs between a 79 d WT and R6/2 and demonstrate the marked reduction in frequency of events in the transgenic. b, Significant decreases in mean frequency of mEPSCs occurred in R6/2 transgenics compared with WT at 5–7 and 11–15 weeks.c, Amplitude–frequency histograms show that the reduction in mEPSCs occurred primarily in events of 7–15 pA at 5–7 and 11–15 weeks. d, Cumulative normalized amplitude–frequency histograms show that the relative amplitude distribution was not altered at any age.

