
Fig. 1.
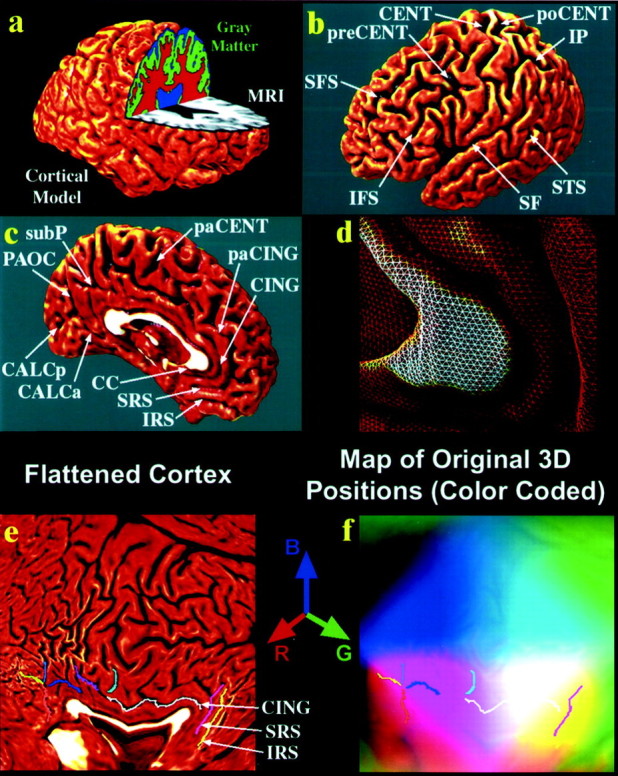
. Creating 3D average cortical models and maps in populations of elderly people and those with AD: cortical flattening. Using a cortical flattening process (a–f) and sulcal matching techniques (Fig. 2), an average model of the cortex (Fig. 2f) can be built for a group of subjects. The goal of this process is to allow data (such as gray matter volumes) to be averaged from corresponding regions of cortex across subjects, reinforcing features that occur consistently. Briefly, the individual MRI scan (a,gray) is processed to split it up into gray matter (green), white matter (red), and cerebrospinal fluid (blue). A 3D cortical surface model (a) is extracted from the scan, and the following sulci are traced as 3D curves directly on this surface model.b, c, Superior and inferior frontal (SFS, IFS), precentral and postcentral (preCENT, poCENT), central (CENT), intraparietal (IP), superior temporal (STS), Sylvian fissures (SF), paracentral (paCENT), cingulate (CING) and paracingulate (paCING), subparietal (subP), callosal (CC), superior and inferior rostral (SRS, IRS), parieto-occipital (PAOC), and anterior and posterior calcarine (CALCa/CALCp) sulci. Because the surface is made up of discrete triangular tiles (d), a process of geometrical flattening can be applied to lay out the cortical regions, and the sulcal curves that delimit them, as features in 2D (e). Information on where these cortical points originally came from in 3D can still be saved in this 2D image format. Using a color-coding system, cortical point 3D locations (x,y, z) are given unique colors (with intensities of red, green, andblue proportional to x, y, and z, respectively), and these colors are plotted into the flat map. These color images represent the cortical shape and are used in Figure 2 to compute information on cortical pattern differences across subjects and to make an “average shape” cortex for a group of subjects.