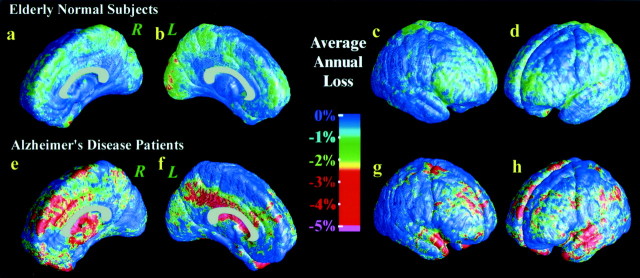
Fig. 4.
. Average gray matter loss rates in healthy aging and AD. The maps show the average local rates of loss for gray matter, in groups of controls (top,a–d) and patients with AD (bottom, e–h). Loss rates are <1% per year in controls. They are significantly higher in AD and strongest in frontal and temporal regions (g, h) at this stage of AD (as the MMSE score falls from 18 to 13).

