
Fig. 2.
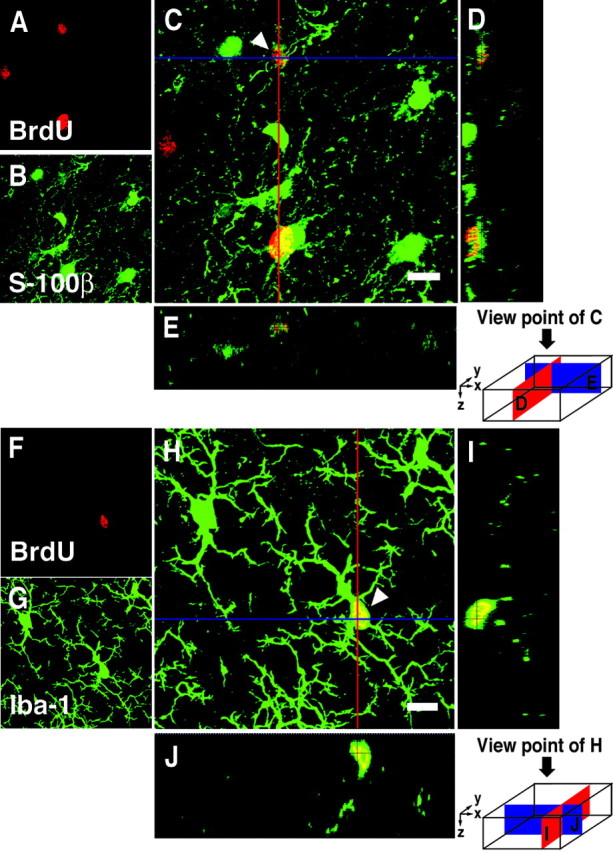
3D images of BrdU+ cells double-labeled with glial markers in the prefrontal cortex of Macaque monkeys.A–E, A cell double-labeled with BrdU and S-100β (astroglial marker indicated by arrowhead).A–C, Images projected from a stack of 42 optical slices at a 0.5 μm interval. A, BrdU (red).B, S-100β (green).C, Overlay. D, They–z cross section of the red line of C. E, Thex–z cross section of the blue line of C. F–J, A cell double-labeled with BrdU and Iba-1 (microglial marker indicated by arrowhead).F–H, Images projected from a stack of 53 optical slices at a 0.5 μm interval. F, BrdU (red).G, Iba-1 (green).H, Overlay. I, They–z cross section of the red line of H. J, Thex–z cross section of the blue line of H. Scale bars, 8 μm.