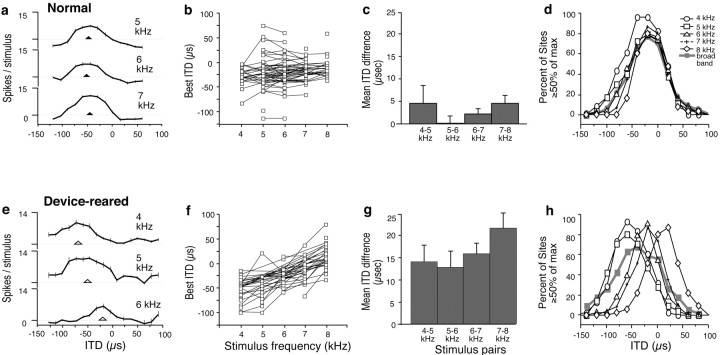
Fig. 3.
Change in ITD tuning with stimulus frequency in normal and device-reared owls. a–d, Data from normal owls. a, Narrowband ITD tuning curves collected at a single site in the nOv. Triangles indicate best ITD values for each curve. Error bars represent SEM. Negative ITD values represent left-ear leading; positive ITD values represent right-ear leading. b, Summary of all narrowband data collected from normal owls (5 owls; 70 sites). Best ITD is plotted as a function of frequency. Lines connect data collected at individual sites. c, Average differences between best ITD values measured at individual sites with narrowband stimuli that had center frequencies separated by 1 kHz. Error bars indicate SEM.d, Composite ITD–response curves for narrowband (1 kHz bandwidth) and broadband (3–12 kHz) stimuli. A composite curve represents the percentage of sites that responded at or above 50% of their maximal response for each of the sampled ITD values. Negative ITDs indicate left-ear leading; positive ITDs indicate right-ear leading. e–h, Data from device-reared owls (5 owls; 60 sites) plotted as described for a–d.

